
Fig. 5
|
Fig. 5
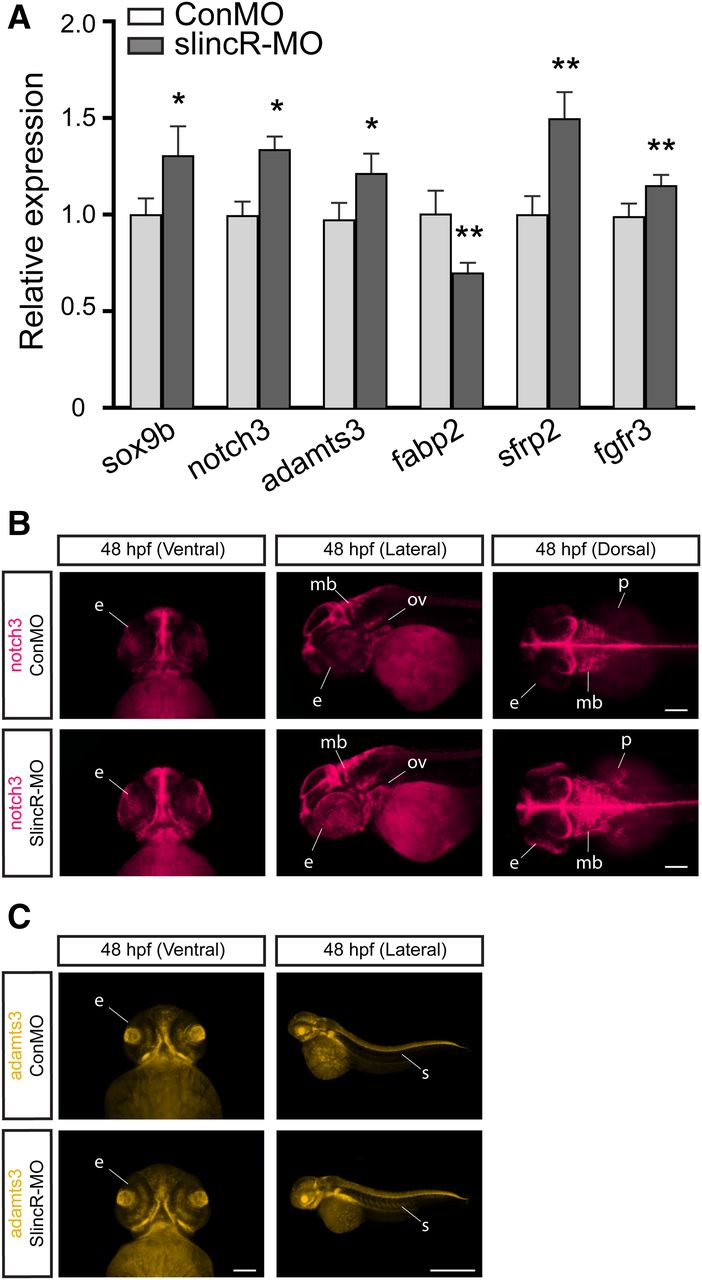
Comparative analysis of the relative expression of sox9b and downstream targets in slincR morphants. (A) Quantitative expression levels of sox9b and downstream targets in slincR and control morphants at 48 hpf. Five out of the nine downstream target genes were significantly different when compared with control morphants. Expression values were analyzed using the 2−ΔΔCT method, normalized to β-actin, and the control morphants served as the calibrator. Samples represent a minimum of three biologic replicates. Results were statistically analyzed using the GraphPad Prism 7.02 software. The data were tested for normality using the Shapiro-Wilk normality test, analyzed using a paired t test, and corrected for multiple comparisons using the Holm-Sidak method, with α = 0.05. Error bars indicate S.D. of the mean; *P < 0.05, **P < 0.01 compared with controls. Dorsal, ventral, and lateral views of in situ hybridization samples targeting notch3 (B) and adamts3 (C) in 48 hpf slincR and control morphants (n = 6–10 embryos); e = eye, ov = otic vesicle, p = pectoral fin, s = somite, and mb = midbrain; 100 µm scale bar.