
Fig. 5
- ID
- ZDB-IMAGE-170502-4
- Genes
- Antibodies
- Publication
- Zhang et al., 2017 - Critical Role for GAB2 in Neuroblastoma Pathogenesis through the Promotion of SHP2/MYCN Cooperation
- All Figures
- Figures for Zhang et al., 2017
|
Fig. 5
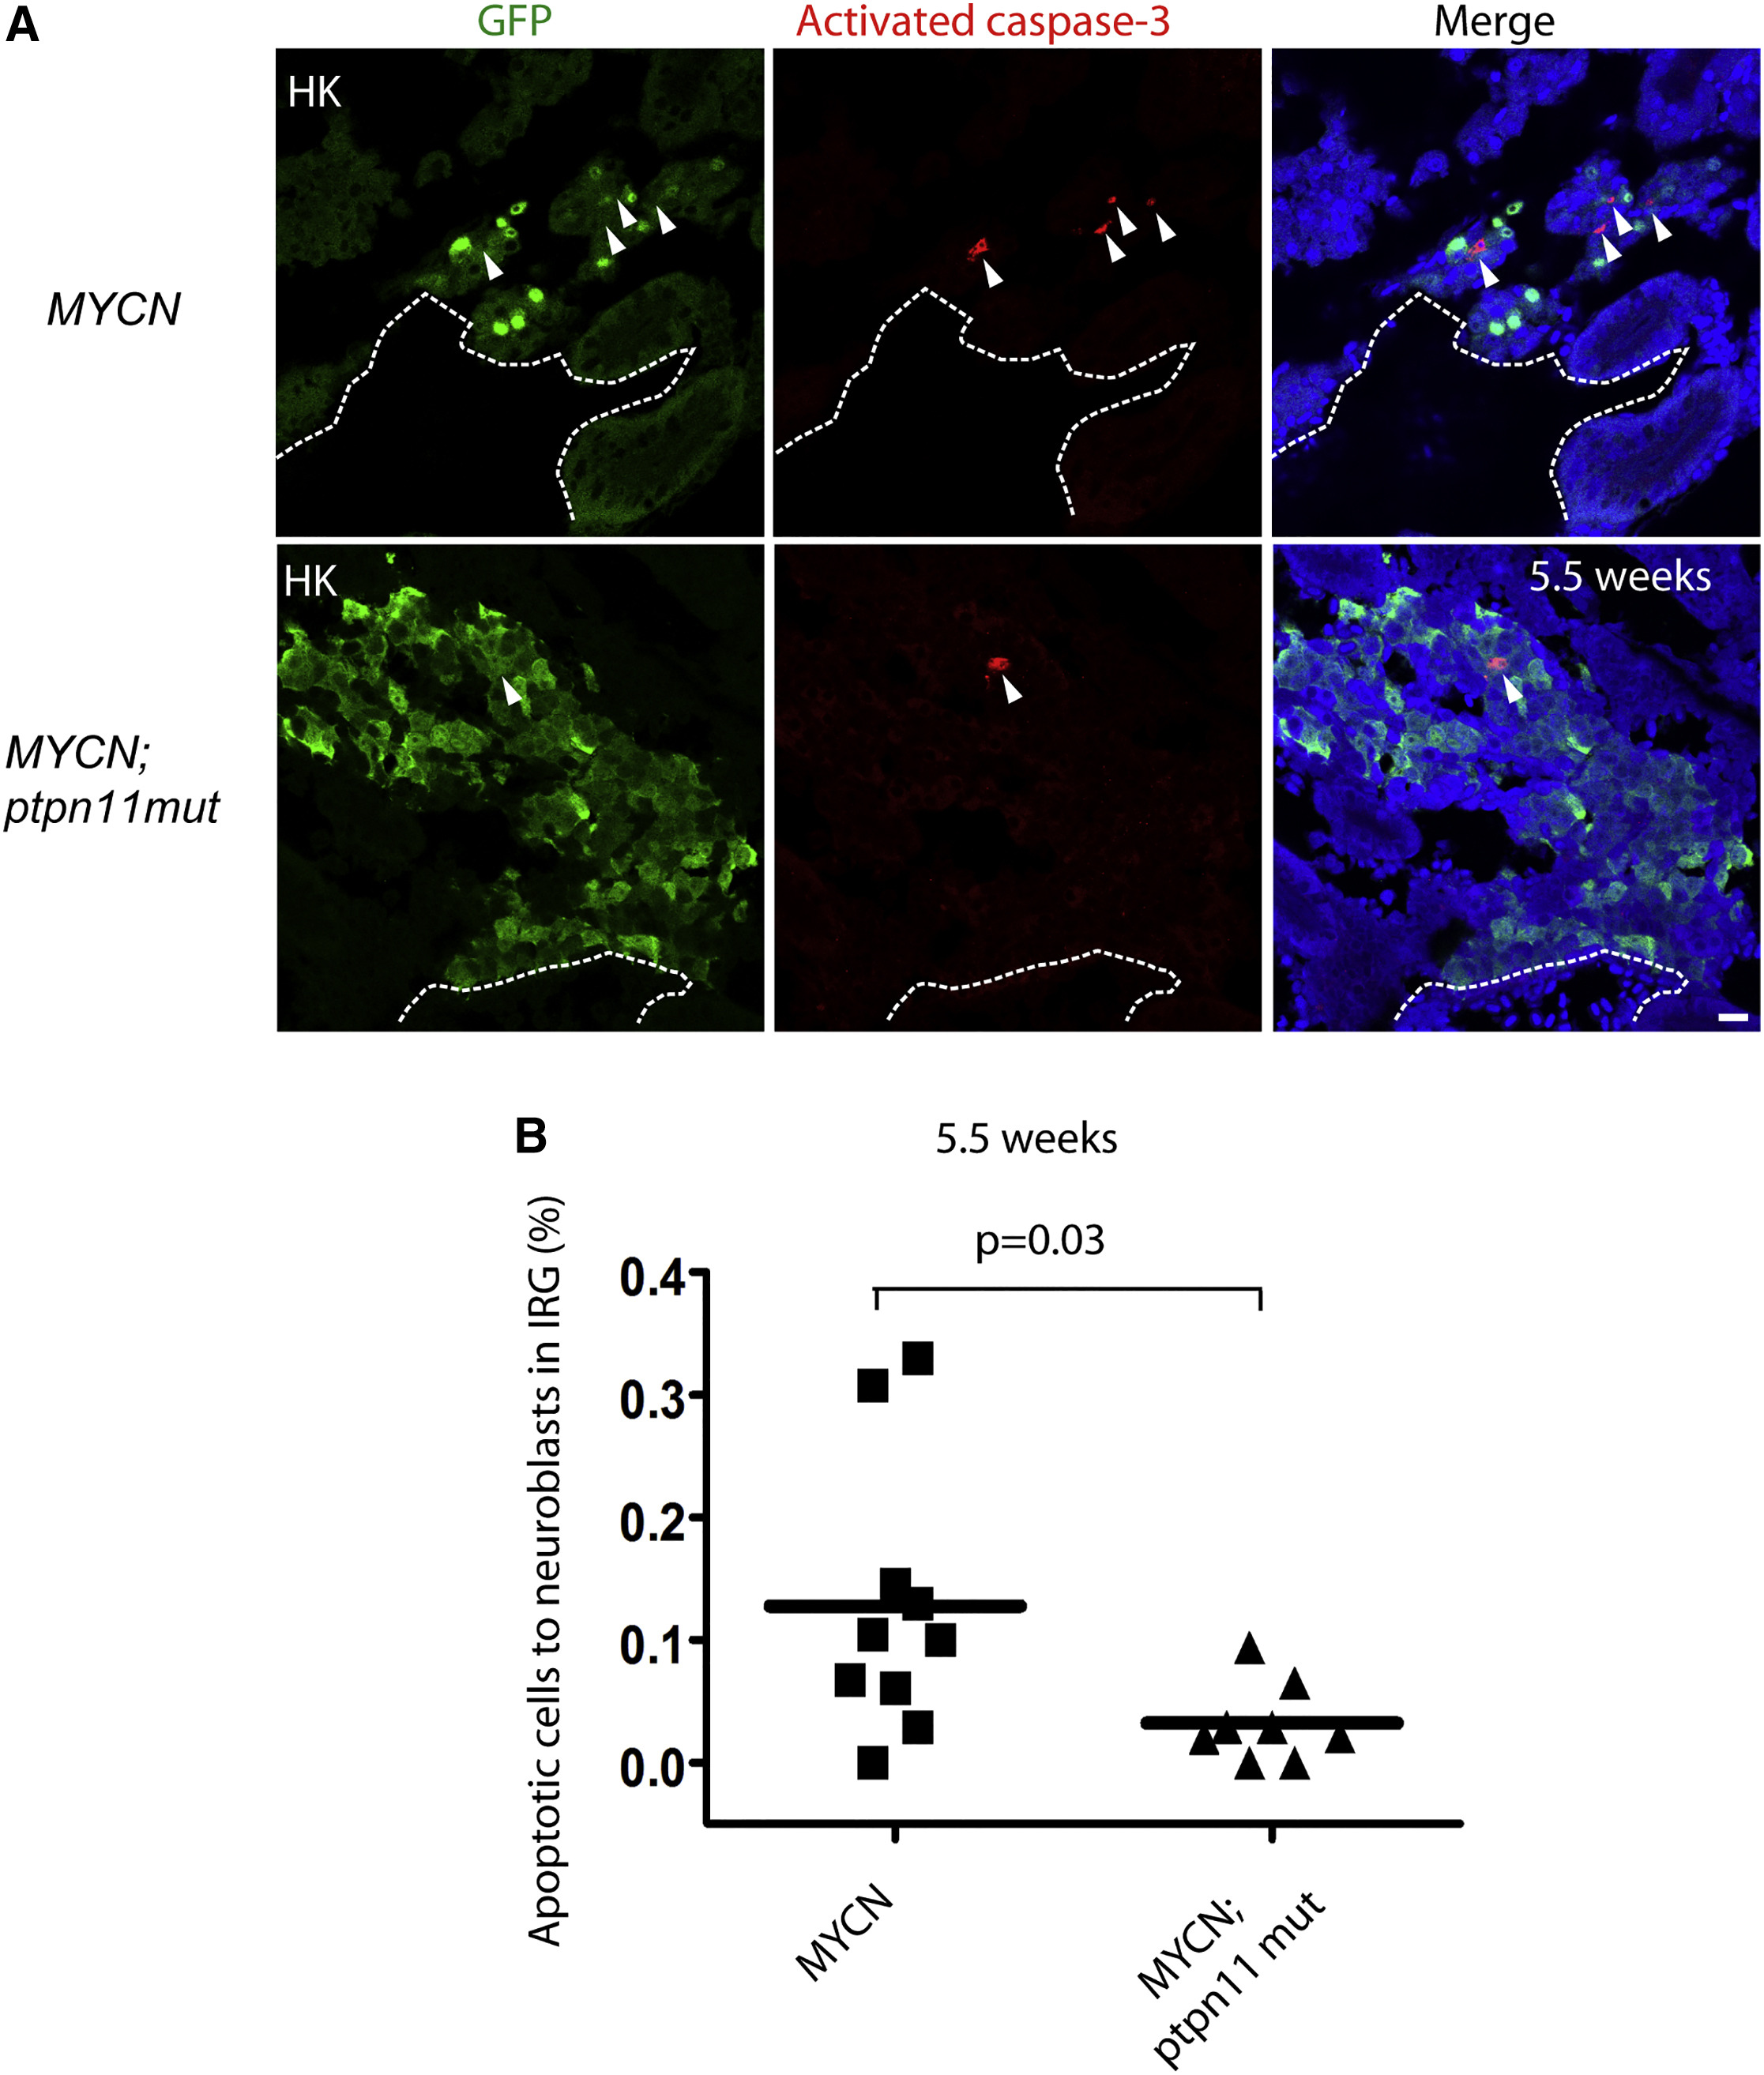
Overexpression of Ptpn11mut Inhibits the Developmentally Timed Apoptotic Response Triggered by MYCN Overexpression in the IRG
(A) Sagittal sections through the IRG of MYCN (top) and MYCN;ptpn11mut (bottom) transgenic fish at 5.5 wpf (dorsal up, anterior left). GFP, green; activated caspase-3, red; DAPI, blue. Arrowheads point to the activated caspase-3+ apoptotic cells. Dotted lines indicate the head kidney (HK) boundary. Scale bars, 10 μm.
(B) Percentage of activated caspase-3+ apoptotic cells to the total number of GFP+ sympathetic neuroblasts in the IRG of MYCN and MYCN;ptpn11mut fish at 5.5 wpf. Mean values (horizontal bars) were compared by the Welch t test (two-tailed).