
|
Fig. 1
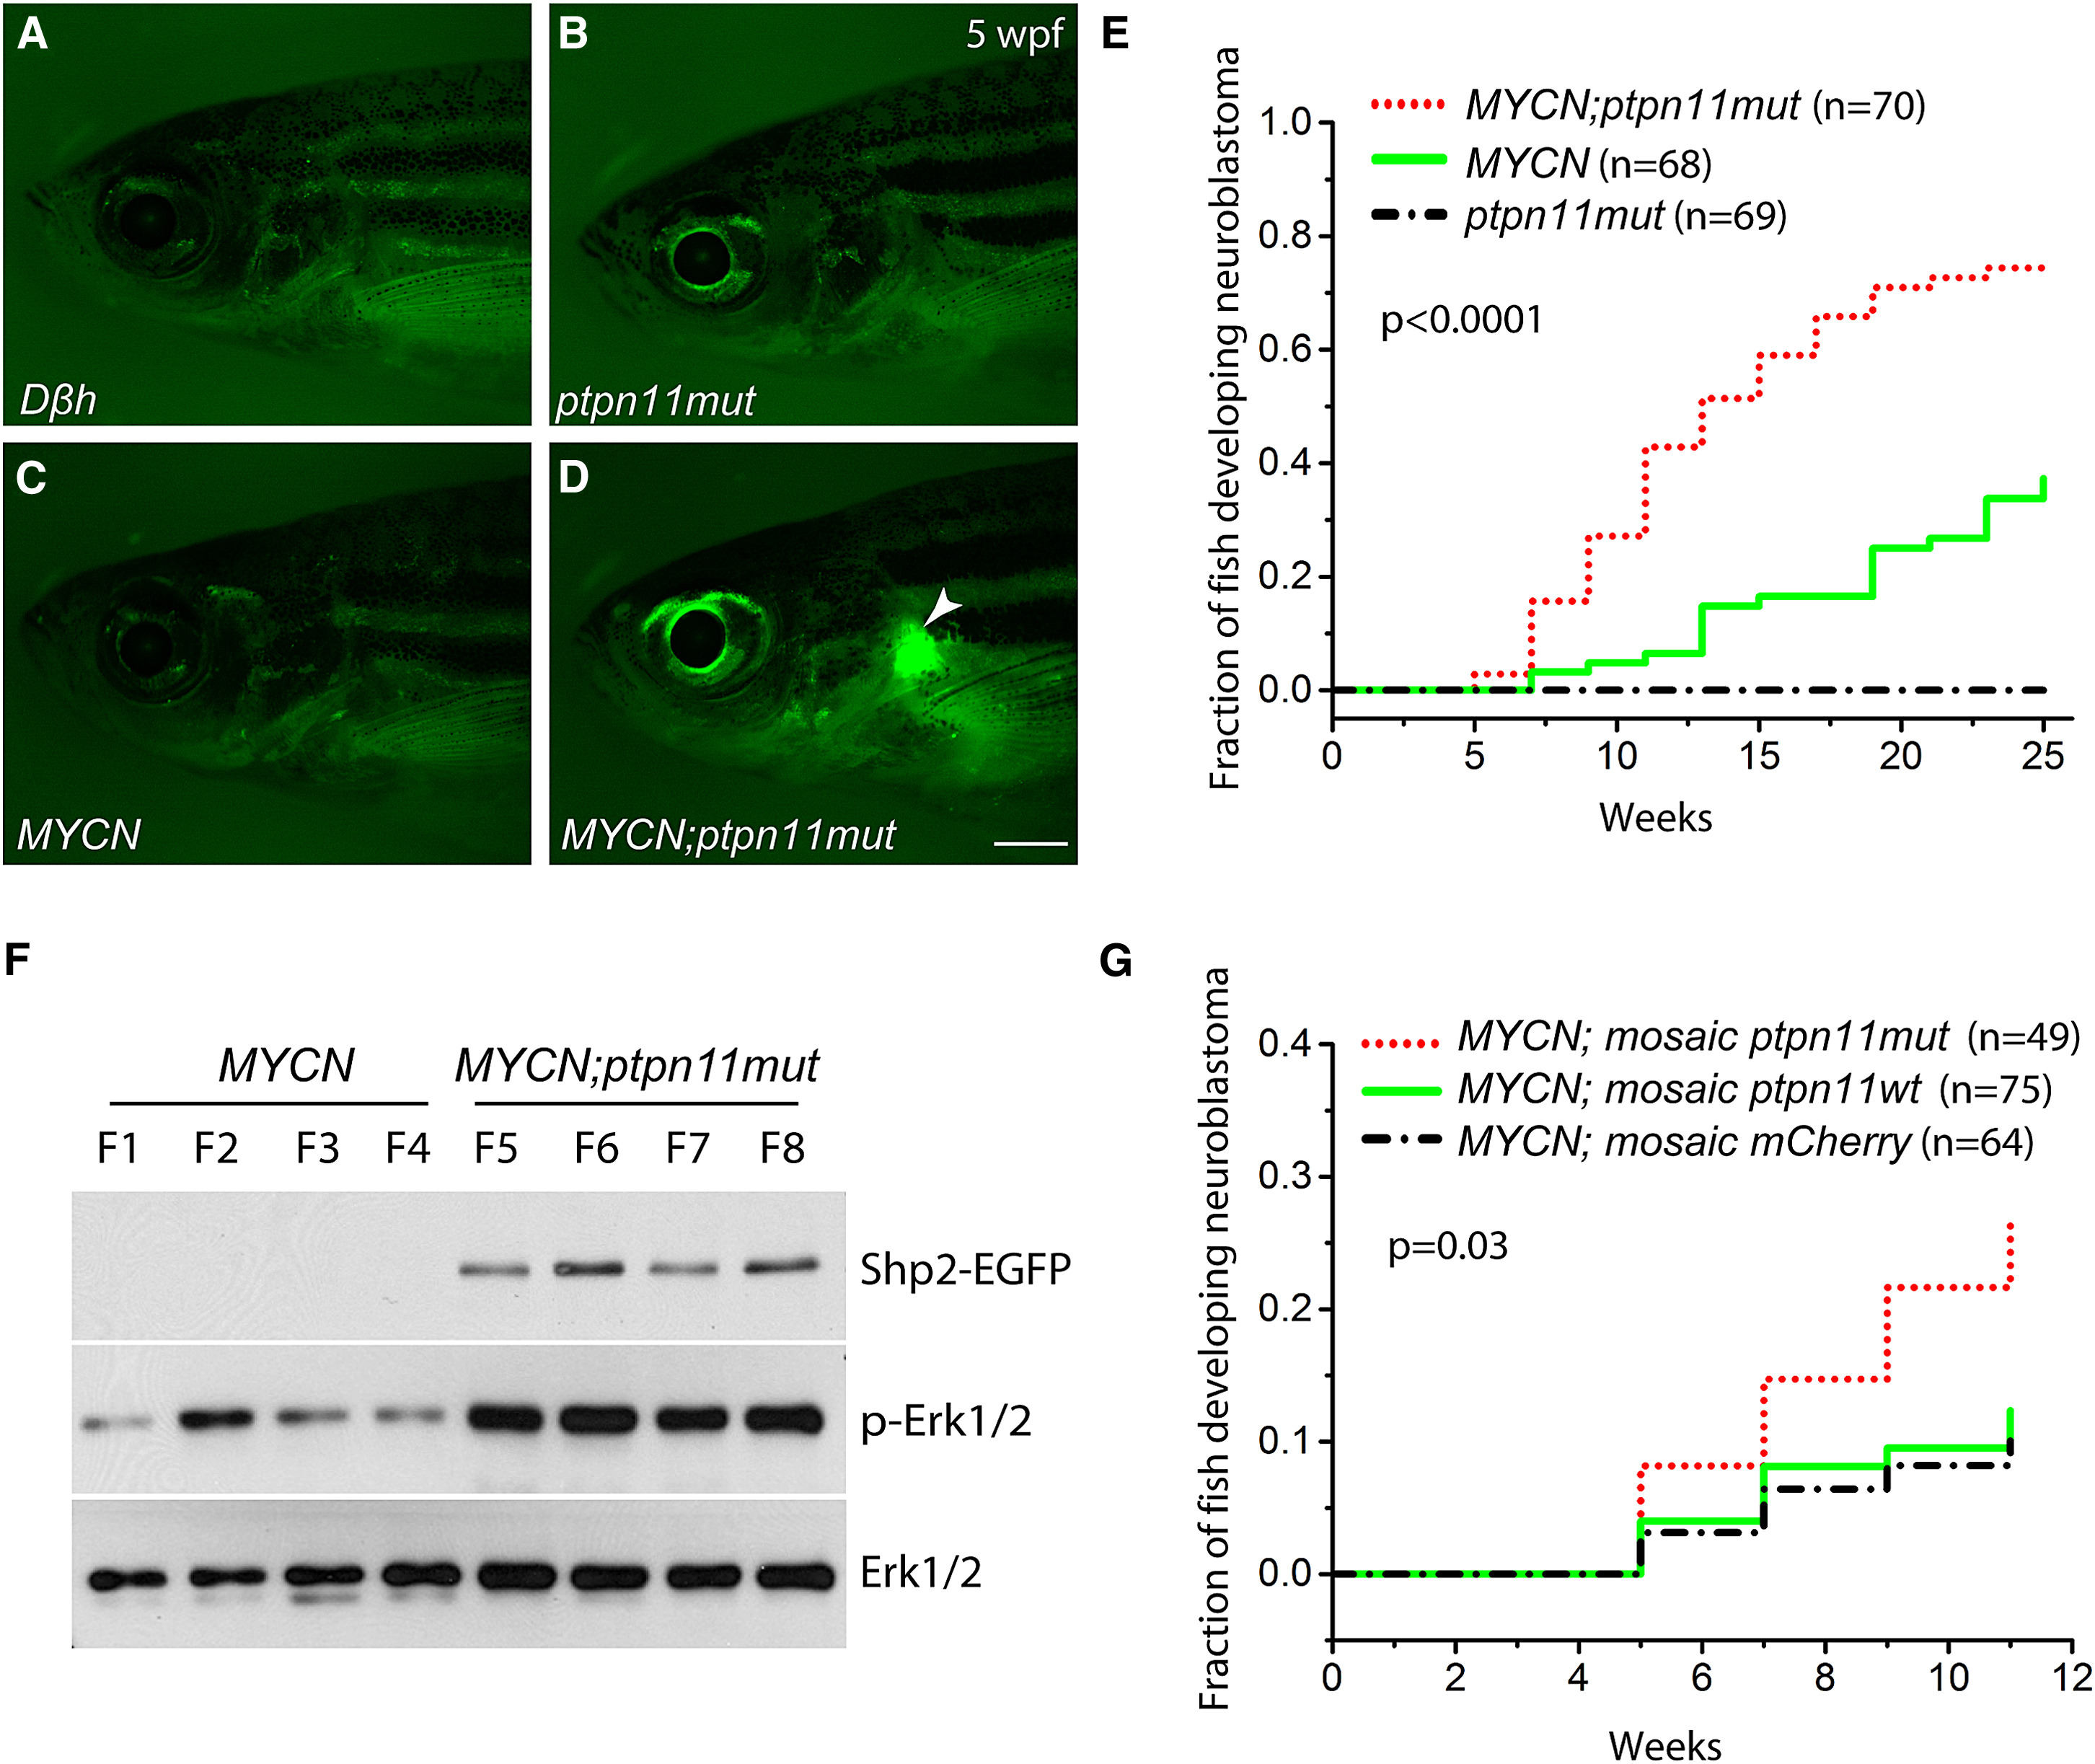
Mutant ptpn11 Synergizes with MYCN in Neuroblastomagenesis
(A–D) Fluorescence micrographs of control Dβh (A), ptpn11mut (B), MYCN (C), and compound MYCN;ptpn11mut (D) transgenic fish. Note the EGFP-expressing tumor in the interrenal gland (IRG; arrowhead in D) at 5 weeks postfertilization (wpf). Scale bar, 1 mm.
(E) Kaplan-Meier analysis showing cumulative frequency of neuroblastoma induction over 6 months in the indicated stable transgenic zebrafish lines (p < 0.0001 for MYCN-only versus MYCN;ptpn11mut by log-rank test).
(F) Phospho-Erk1/2 immunoblots of lysates from individual MYCN-only (F1–F4) or MYCN;ptpn11mut tumors (F5–F8). Total Erk1/2 levels serve as a loading control.
(G) Kaplan-Meier analysis of cumulative frequency of neuroblastoma induction over 11 weeks in MYCN transgenic fish mosaically overexpressing mCherry alone (MYCN;mosaic mCherry), coexpressing mCherry with ptpn11wt (MYCN;mosaic ptpn11wt), or coexpressing mCherry with ptpn11mut (MYCN;mosaic ptpn11mut). MYCN;mosaic ptpn11mut versus MYCN;mosaic mCherry transgenic fish is significant by log-rank test (p = 0.03).
See also Figure S1.