
|
Fig. 4
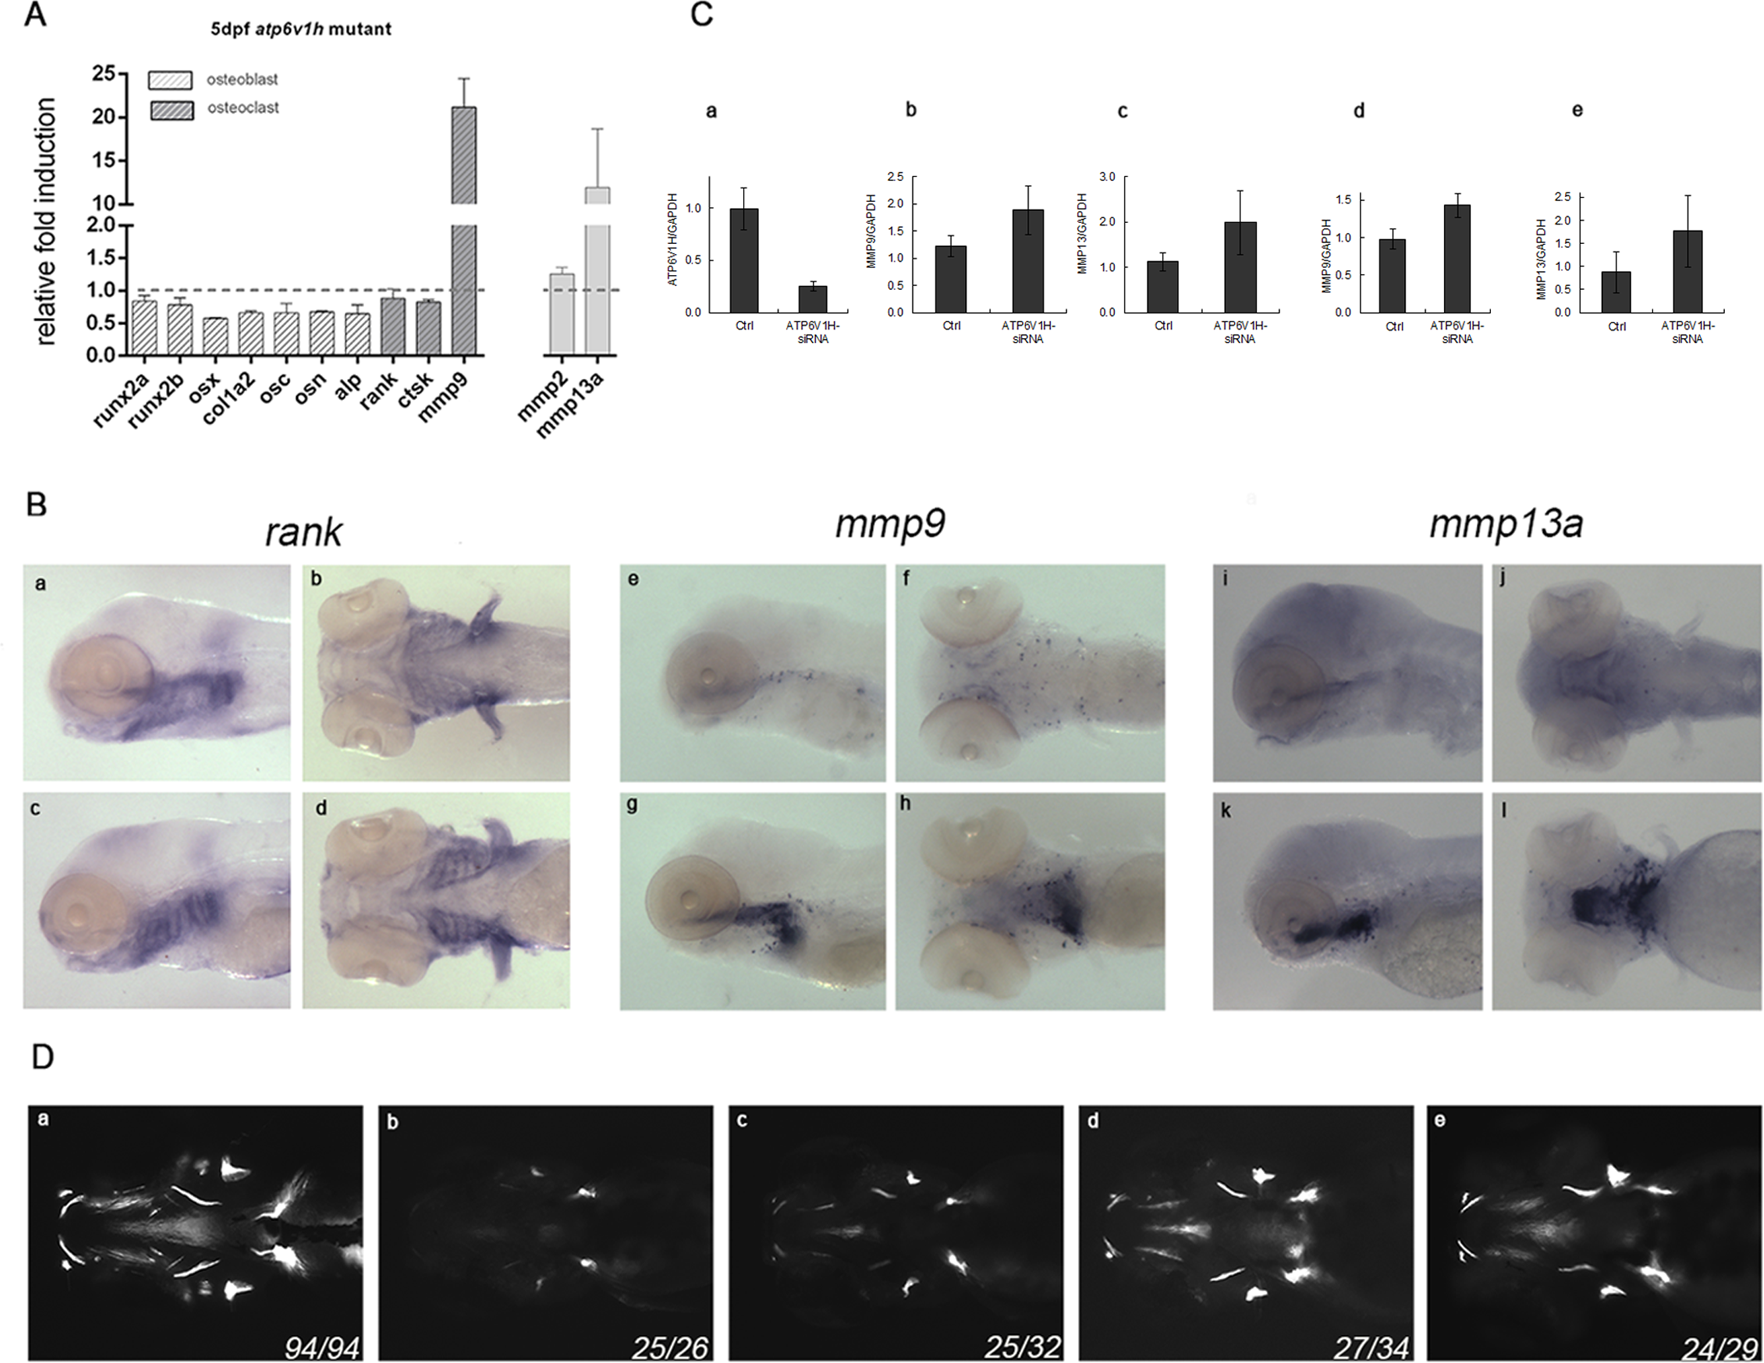
Induction of mmp9/mmp13 and rescue of atp6v1h-deficient phenotype.
In (A), qPCR analysis of designated marker genes showing significant induction of mmp9 and mmp13 mRNA expression in atp6v1h mutant. Analysis of osteoclast cells by RNA whole mount in situ hybridization. atp6v1h mutant embryos showing significant increases of mmp9 and mmp13a signals in embryonic head skeleton (e/f/i/j wild type, g/h/k/l mutant), but osteoclast marker rank pattern is not changed (a/b wild type, c/d mutant) (B). In (C), analysis of Mmp9/Mmp13 expression in mouse osteoclast Raw264.7 cells after knockdown of Atp6v1h by siRNA is shown. When Atp6v1h expression was knocked down by siRNA (a), the expression of Mmp9 (b) and Mmp13 (c) were induced. Similarly, the induction of Mmp9 (d) and Mmp13 (e) was also observed in RANKL-induced differentiated mouse osteoclast Raw264.7 cells. In (D), MMP inhibition rescues the bone phenotype in Atp16V1h mutant fish as detected by calcein staining; a, wild type, 0.5% DMSO; b, mutant, 0.5% DMSO; c, mutant treated with 200uM MMP9 inhibitor II in 0.5% DMSO; d, mutant treated with 20uM MMP13 inhibitor in 0.5% DMSO; e, mutant treated with 50uM MMP9/13 inhibitor I in 0.5% DMSO. Images are ventral views of 6 dpf embryos.