
Fig. 1
- ID
- ZDB-IMAGE-170210-2
- Genes
- Antibodies
- Publication
- Wang et al., 2016 - The somite-secreted factor Maeg promotes zebrafish embryonic angiogenesis
- All Figures
- Figures for Wang et al., 2016
|
Fig. 1
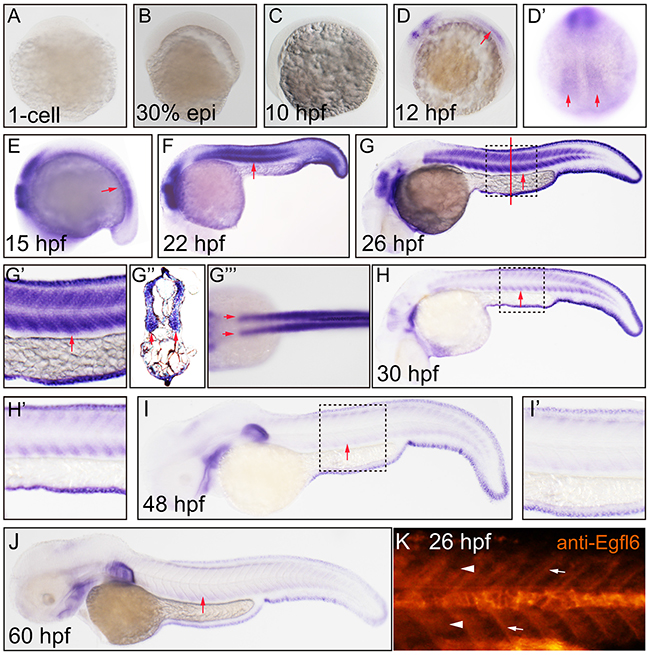
Maeg dynamically expressed in zebrafish developing somite. Expression of maeg was analyzed by whole mount in situ hybridization and whole mount antibody staining. A. 1-cell, lateral view, no staining. B. 30% epiboly, lateral view, no staining. C. 10 hpf, lateral view, no staining. D. 12 hpf, lateral view, arrow indicates somite. D’. 12 hpf, lateral view, arrows indicate somite. E. 15 hpf, lateral view, arrow indicates somite. F. 22 hpf, lateral view, arrow indicates somite. G. 26 hpf, lateral view, arrow indicates somite, square in dash line indicates the magnified region in G’. red line indicates the section position G’’, G’’’. 26 hpf, dorsal view, arrows indicate myotomes. H. 30 hpf, lateral view, arrow indicates somite, square in dash line indicates the magnified region in H’, I. 48 hpf, lateral view, arrow indicates somite, square in dash line indicates the magnified region in I’, J. 60 hpf, lateral view, arrow indicates somite. K. 26 hpf, lateral view, arrowheads indicate somites, arrows indicate somite borders.