
|
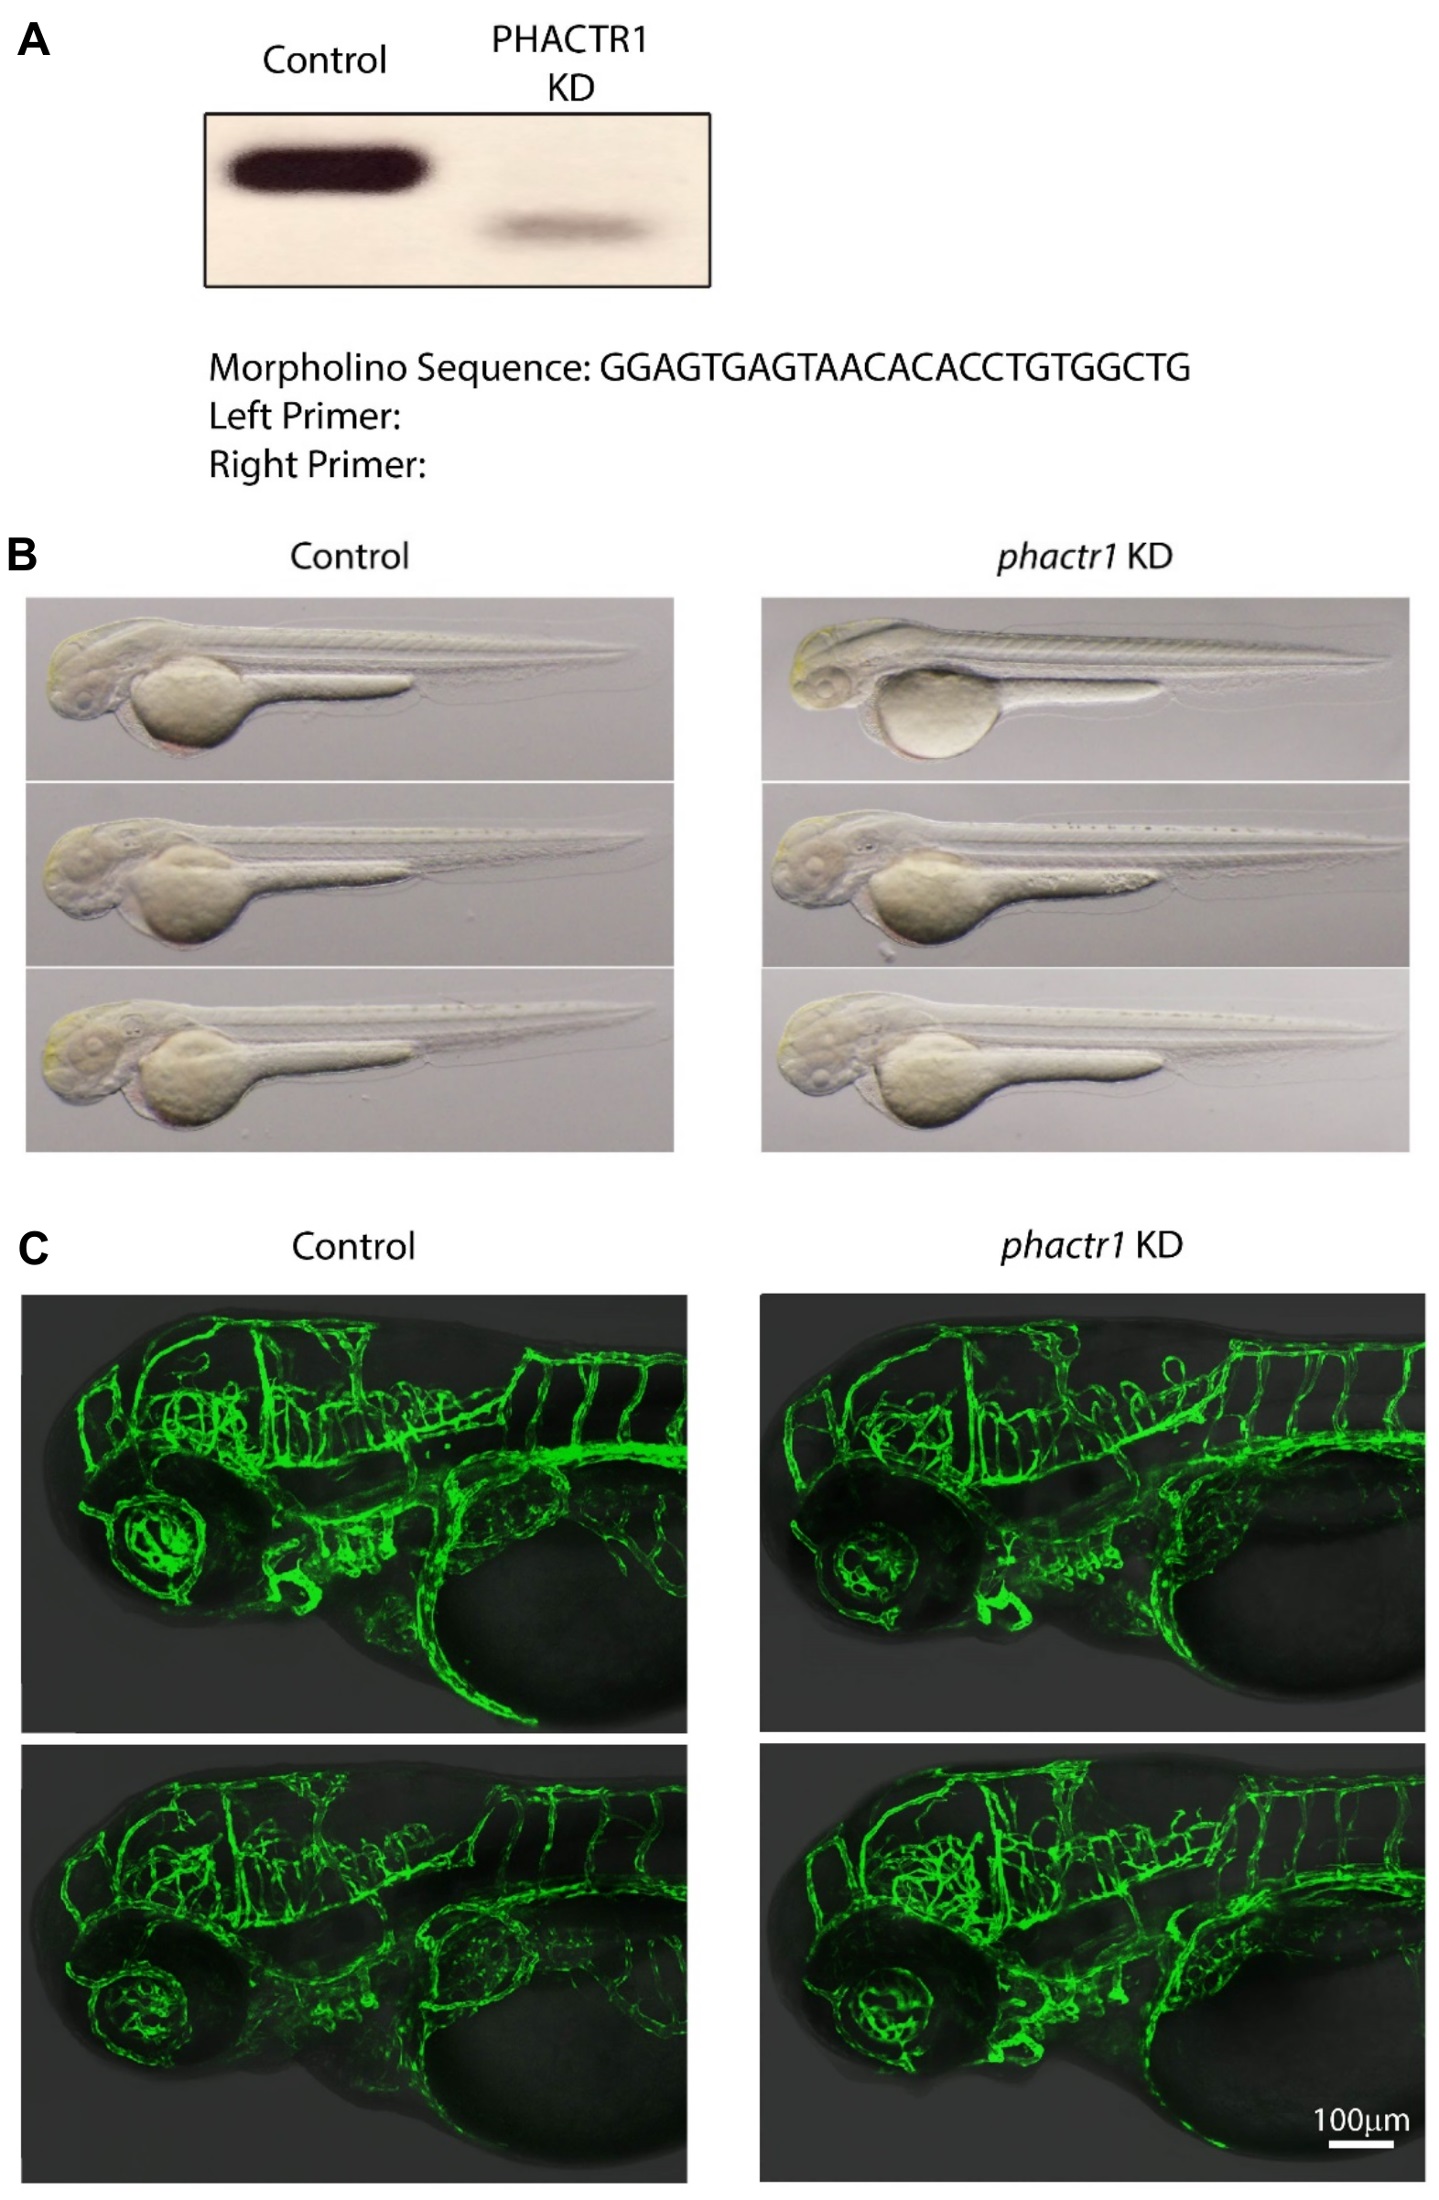
Fig. S3
Phenotypic evaluation of phactr1 knockdown zebrafish.
(A) RT-PCR evaluation of splice alteration observed following microinjection of phactr1 morpholino (PHACTR1 KD). (B) Brightfield micrographs of overt morphology at 60 hours post fertilization. (C) Two-dimensional projections obtained from z-series confocal images in the head and trunk of control and phactr1 knockdown zebrafish embryos. Green represents the vascular endothelium as marked by EGFP. Greyscale represents the corresponding DIC brightfield image of the fish head and trunk region. HPV indicates the relative position of the developing hepatic portal vein