
Image
|
Figure Caption
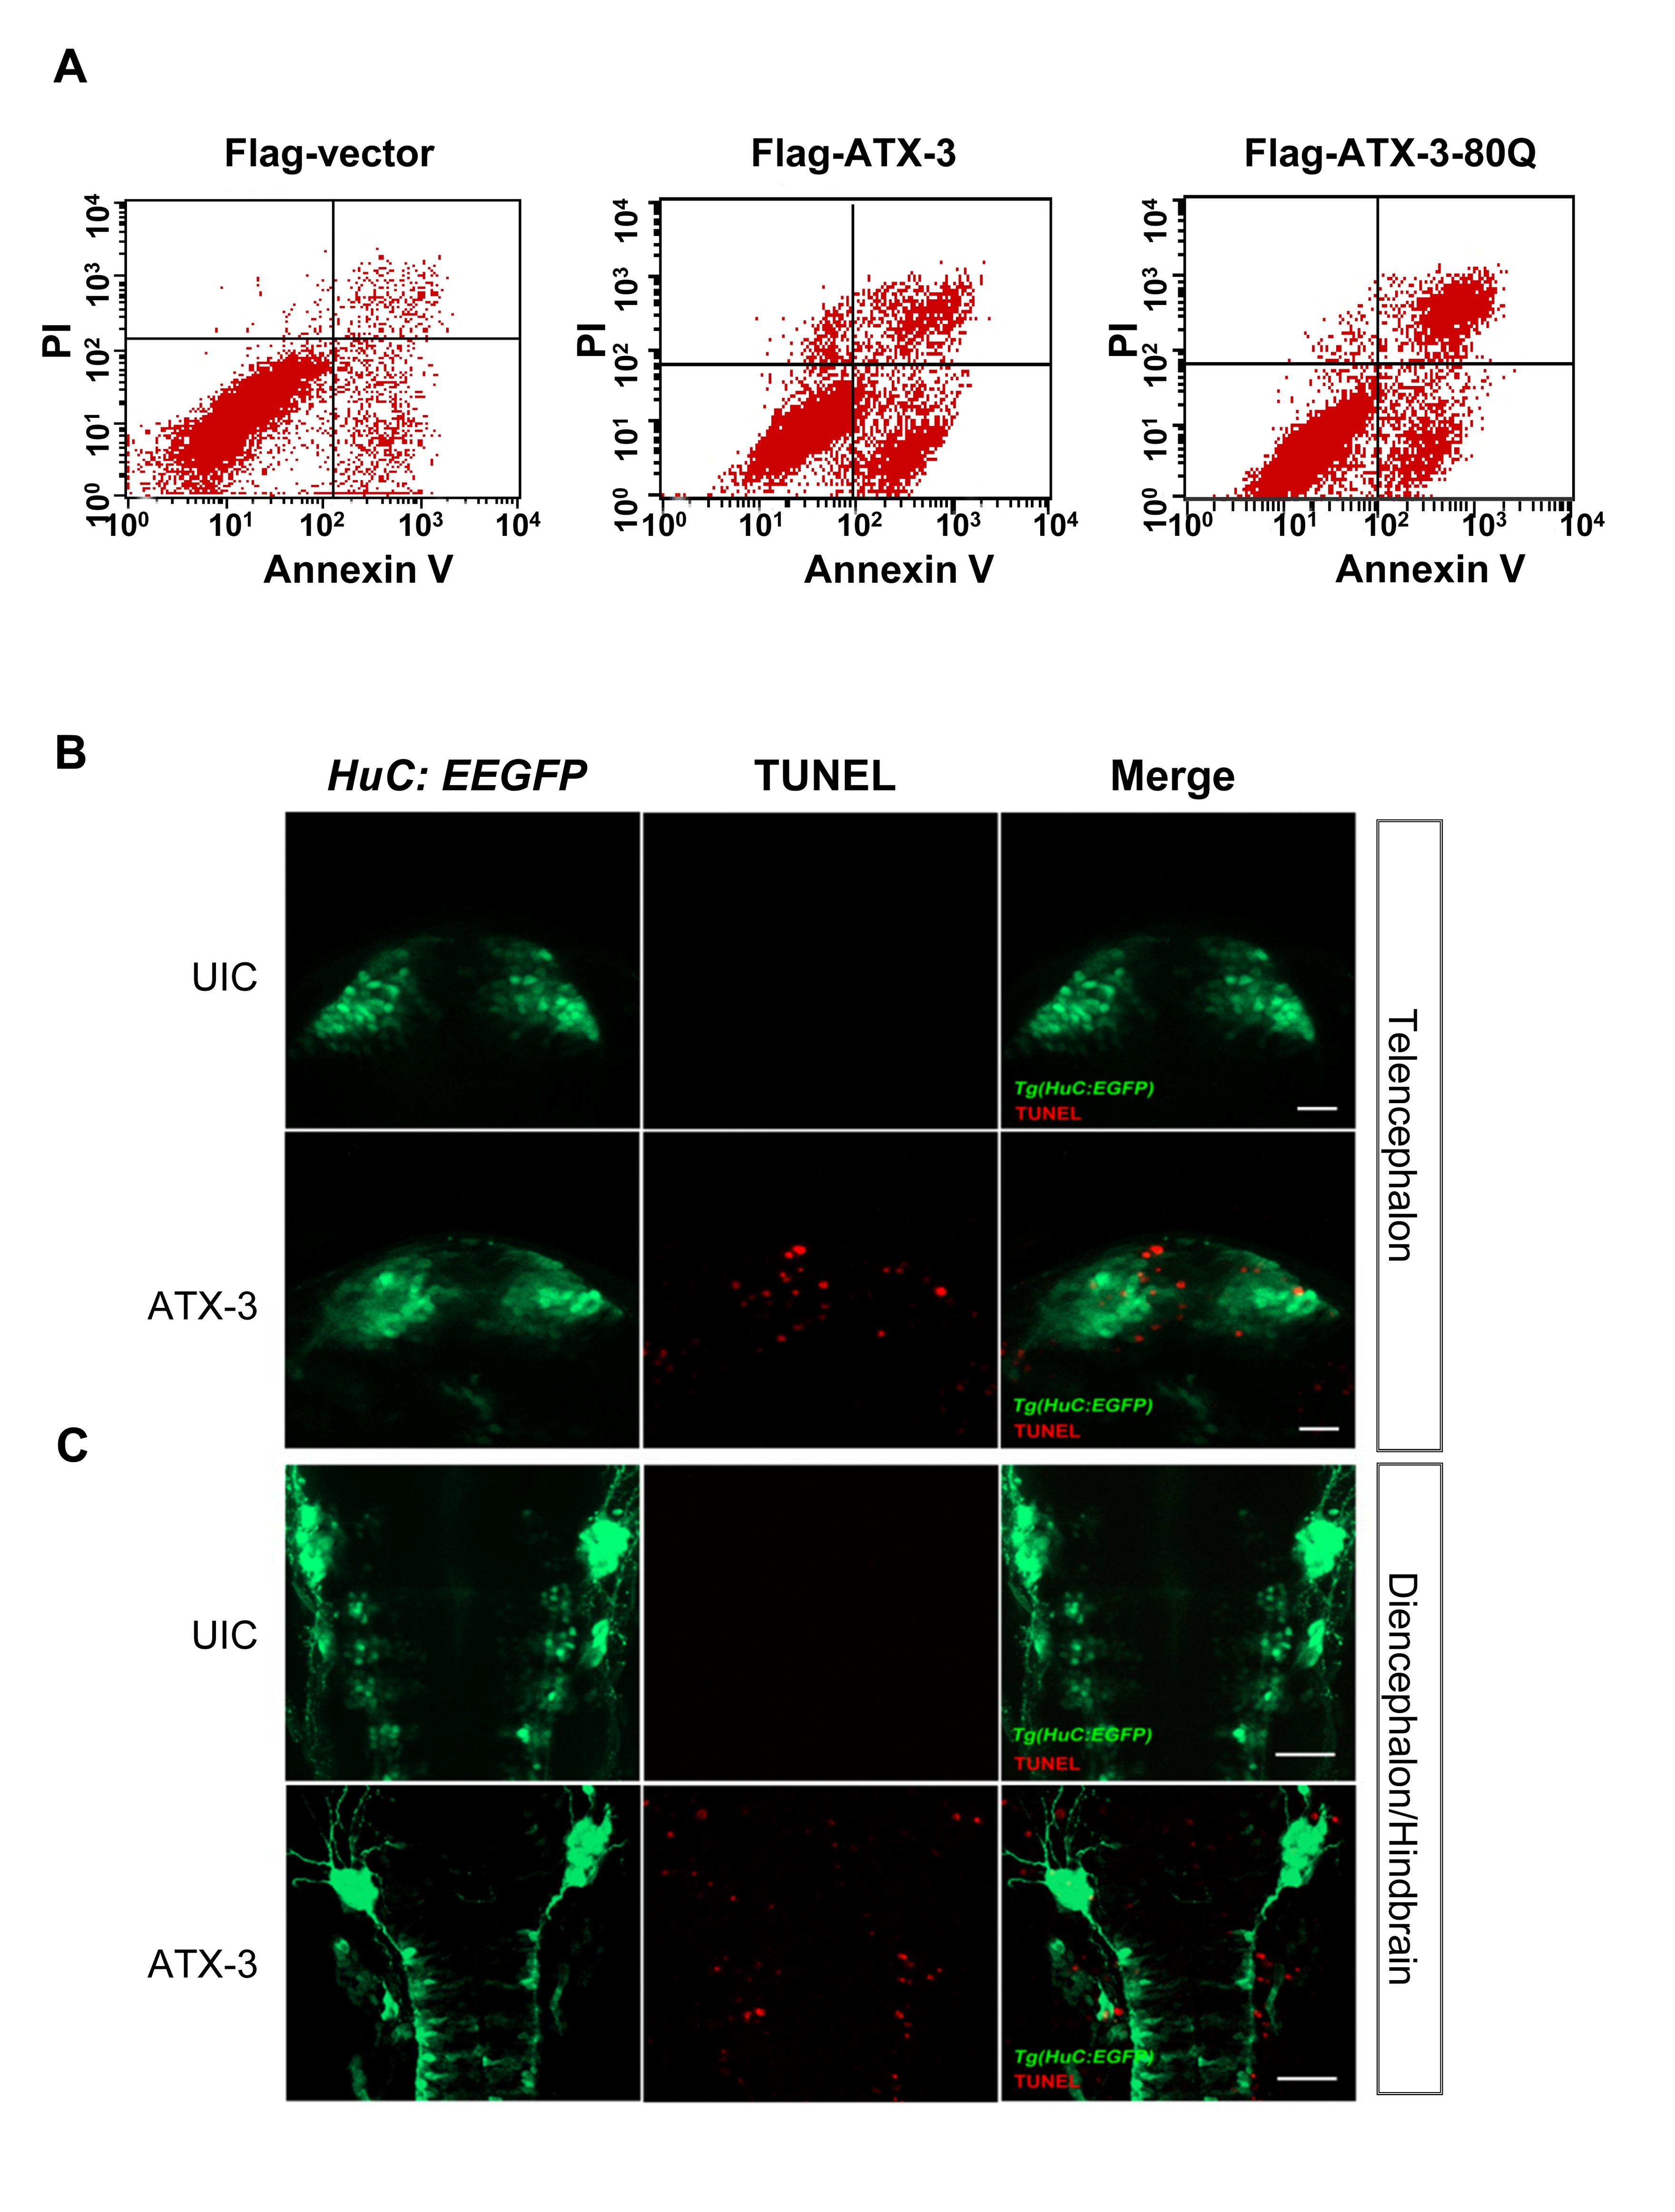
Fig. S3
Ataxin-3 expression-induced cell death occurs in cells and in HuC positive brain regions in zebrafish.
(A) Flow cytometry analysis using Annexin V-FITC/PI staining in HCT116 p53+/+ cells. (B and C) Dorsal views with anterior to the top of Tg(HuC:EGFP) embryos. Colocalization of HuC:EGFP (green) and TUNEL positive foci (red) in the telencephalon region (B) and diencephalon/hindbrain (C). Tg(HuC:EGFP) transgenic embryos uninjected control (UIC) or injected with ataxin-3 were collected for TUNEL staining at 24 hpf. Scale bars, 20 μm for B and 50 μm for C.
Figure Data
Acknowledgments
This image is the copyrighted work of the attributed author or publisher, and
ZFIN has permission only to display this image to its users.
Additional permissions should be obtained from the applicable author or publisher of the image.
Full text @ PLoS Biol.