
Image
|
Figure Caption
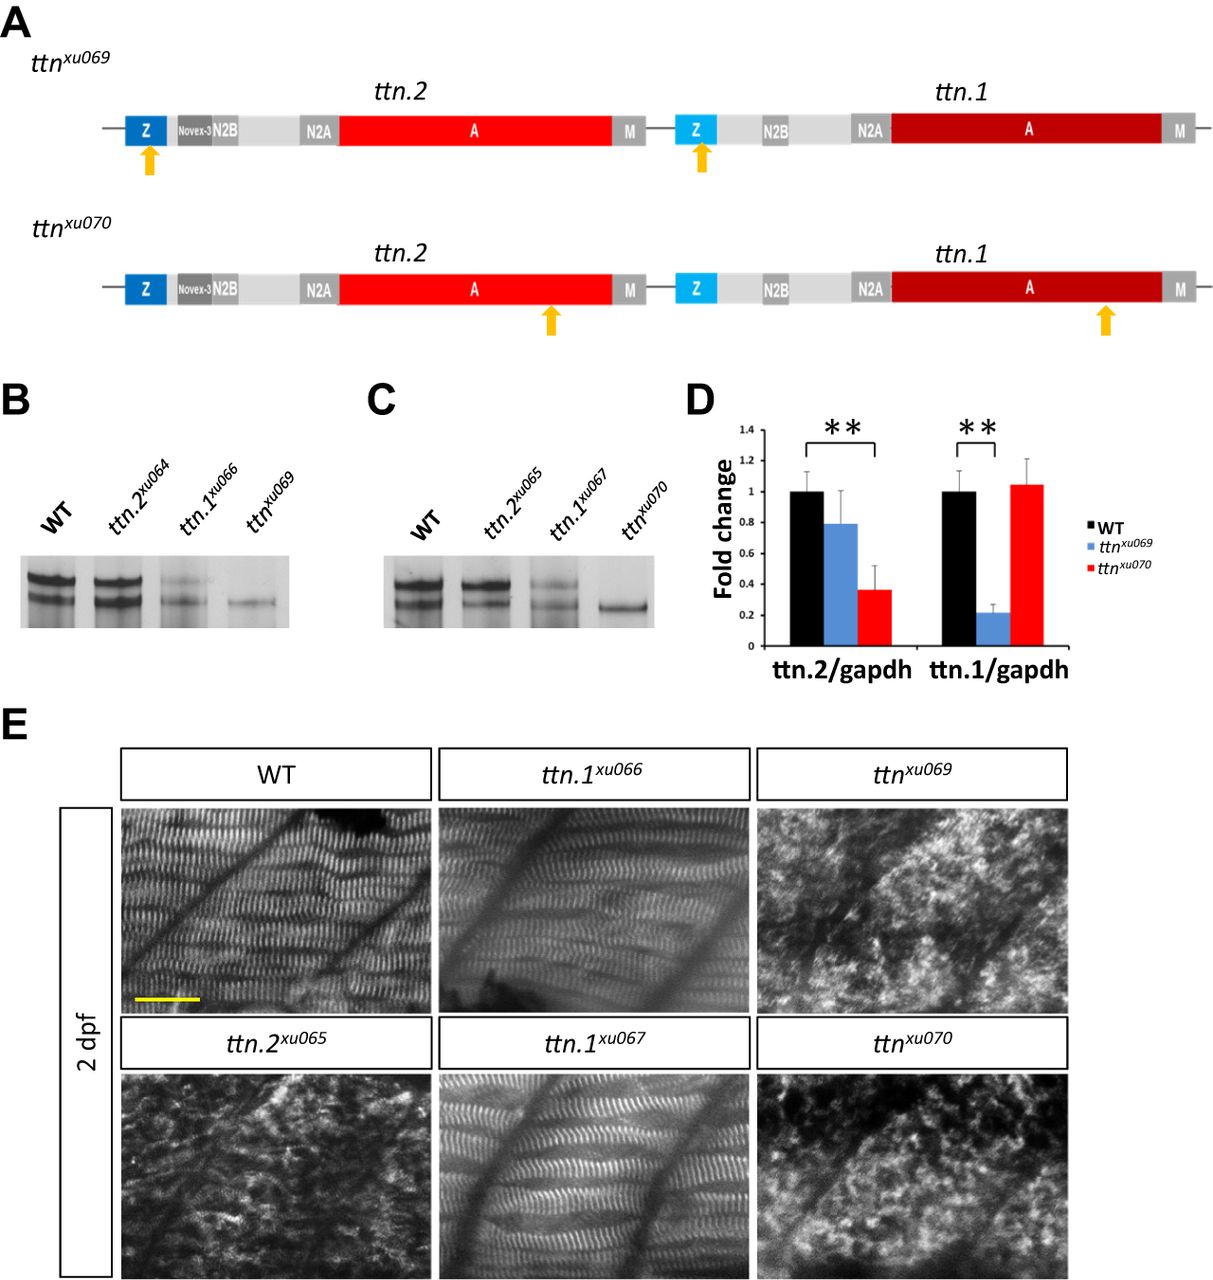
Fig. 4
Mutants ttnxu69 and ttnxu070 overcome protein compensation and exhibit more severe phenotypes. (A) Schematic representation of two double mutants, ttnxu069 and ttnxu070. Arrows indicate locations of mutations. (B) Protein extracts from 2 dpf larvae of ttnxu69 mutants analyzed by 2% SDS-agarose gel and silver staining. (C) Protein analysis of ttnxu070. (D) ttn.2 and ttn.1 mRNA expression levels in ttnxu070 and ttnxu69 mutants, as revealed by qPCR using primers targeting ttn.2 and ttn.1, respectively. Means±s.d., N=5. **P<0.01. (E) Immunostaining of 2 dpf embryos for α-Actinin. Scale bar: 20 μm.
Figure Data
Acknowledgments
This image is the copyrighted work of the attributed author or publisher, and
ZFIN has permission only to display this image to its users.
Additional permissions should be obtained from the applicable author or publisher of the image.
Full text @ Development