
Image
|
Figure Caption
Fig. S1
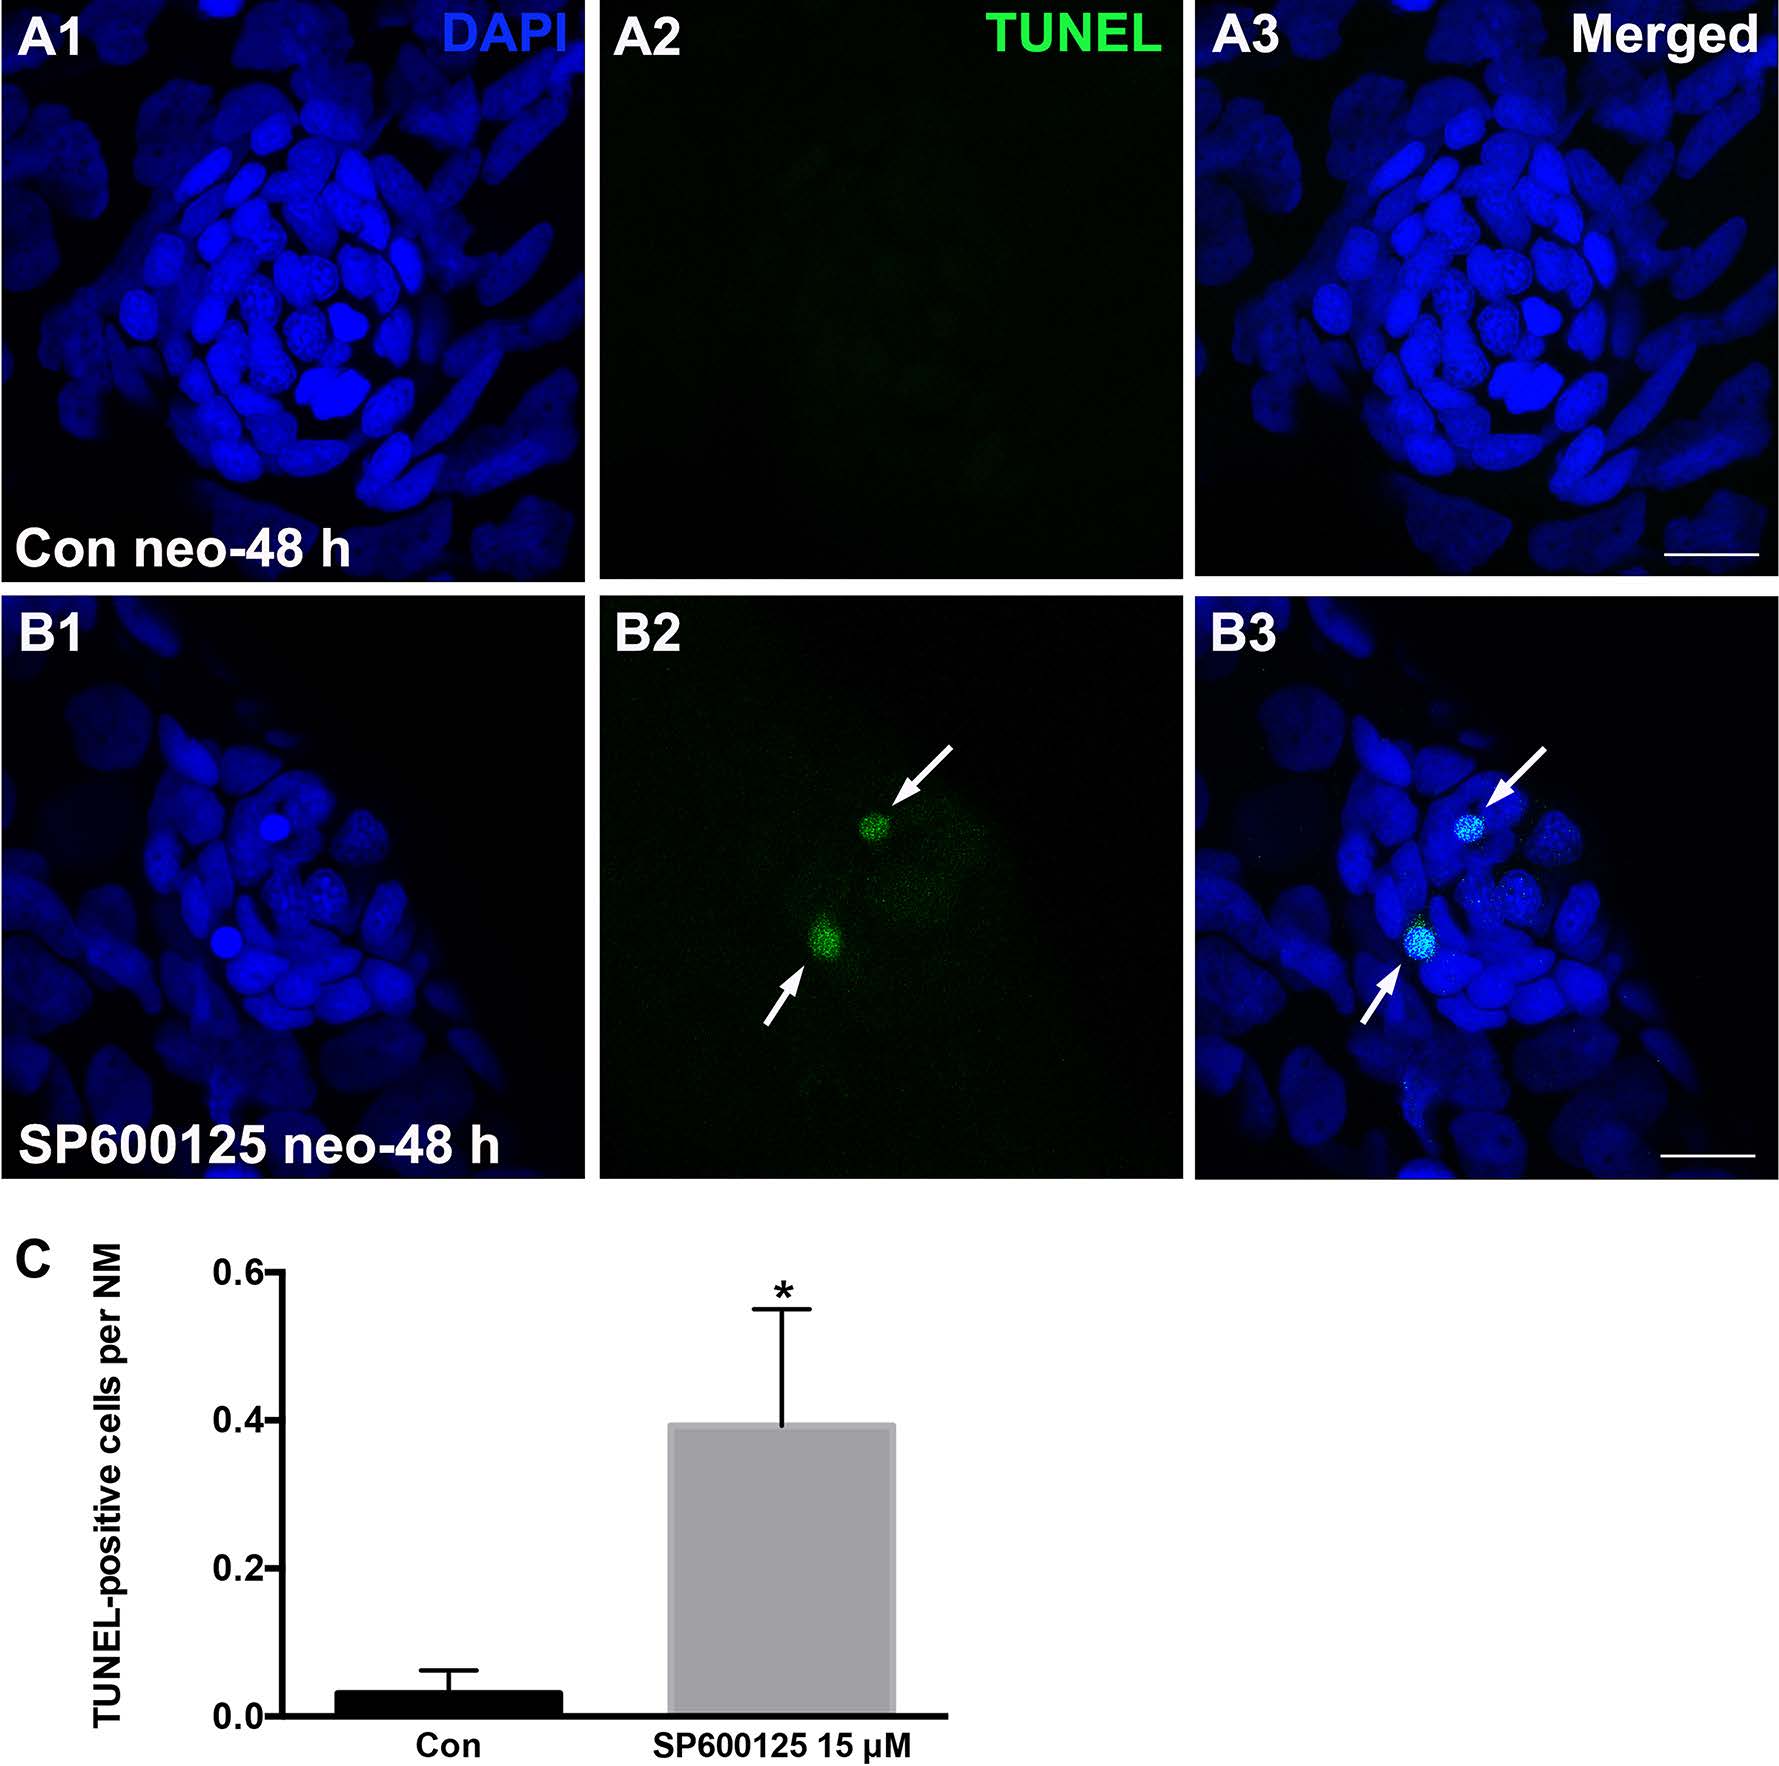
SP600125 induces apoptosis in neuromasts. (A–B) TUNEL staining in the neuromasts of control and SP600125 (15 μM)-treated larva at 48 h following neomycin-induced hair cell death. White arrows indicate TUNEL-positive cells. Scale bar = 10 μm. (C) Quantification of apoptosis induced by SP600125 treatment. Data are expressed as mean ± s.e.m, *p < 0.05. (n = 32 neuromasts from control animals, n = 28 neuromasts from 15 μM SP600125-treated animals; unpaired t test, two-tailed, t = 2.401, df = 58, p = 0.0196).
Acknowledgments
This image is the copyrighted work of the attributed author or publisher, and
ZFIN has permission only to display this image to its users.
Additional permissions should be obtained from the applicable author or publisher of the image.
Full text @ Oncotarget