
Image
|
Figure Caption
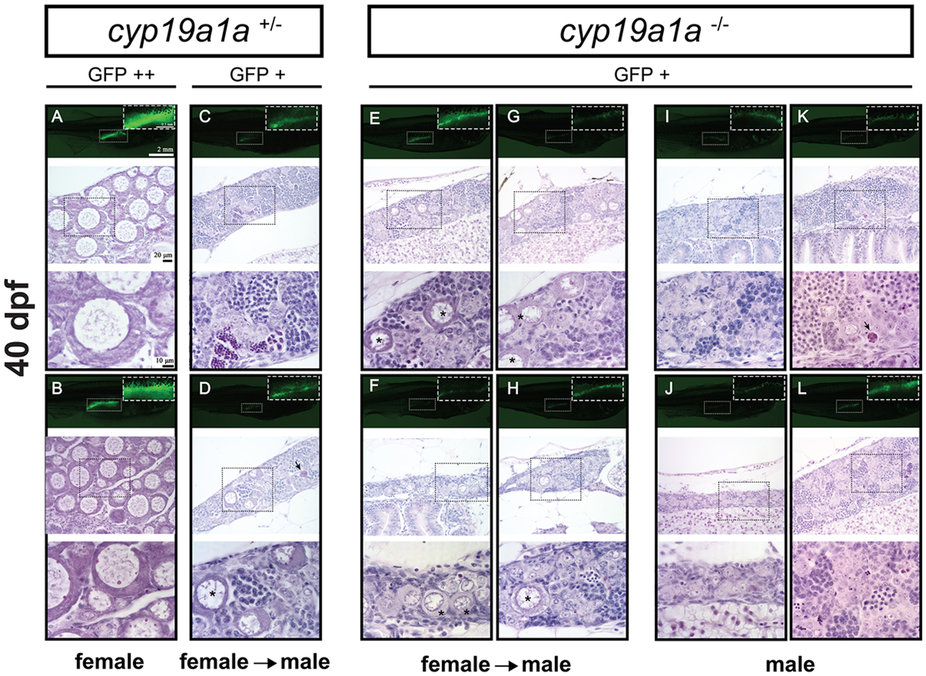
Fig. 7
Gonad development at 40 dpf in the control (cyp19a1a+/−; fish A–D) and mutant (cyp19a1a−/−; fish E–L). The control fish had well-differentiated ovary (A and B) and testis (C and D), whereas all the mutant individuals were undergoing or had completed ovary-testis transformation with typical testicular tissues containing different stages of spermatogenic cells. Some individuals (E–H) still contained a few typical EPOs (asterisks) scattered among the testicular tissues. Arrows indicate the apoptotic germ cells.
Figure Data
Acknowledgments
This image is the copyrighted work of the attributed author or publisher, and
ZFIN has permission only to display this image to its users.
Additional permissions should be obtained from the applicable author or publisher of the image.
Full text @ Sci. Rep.