
|
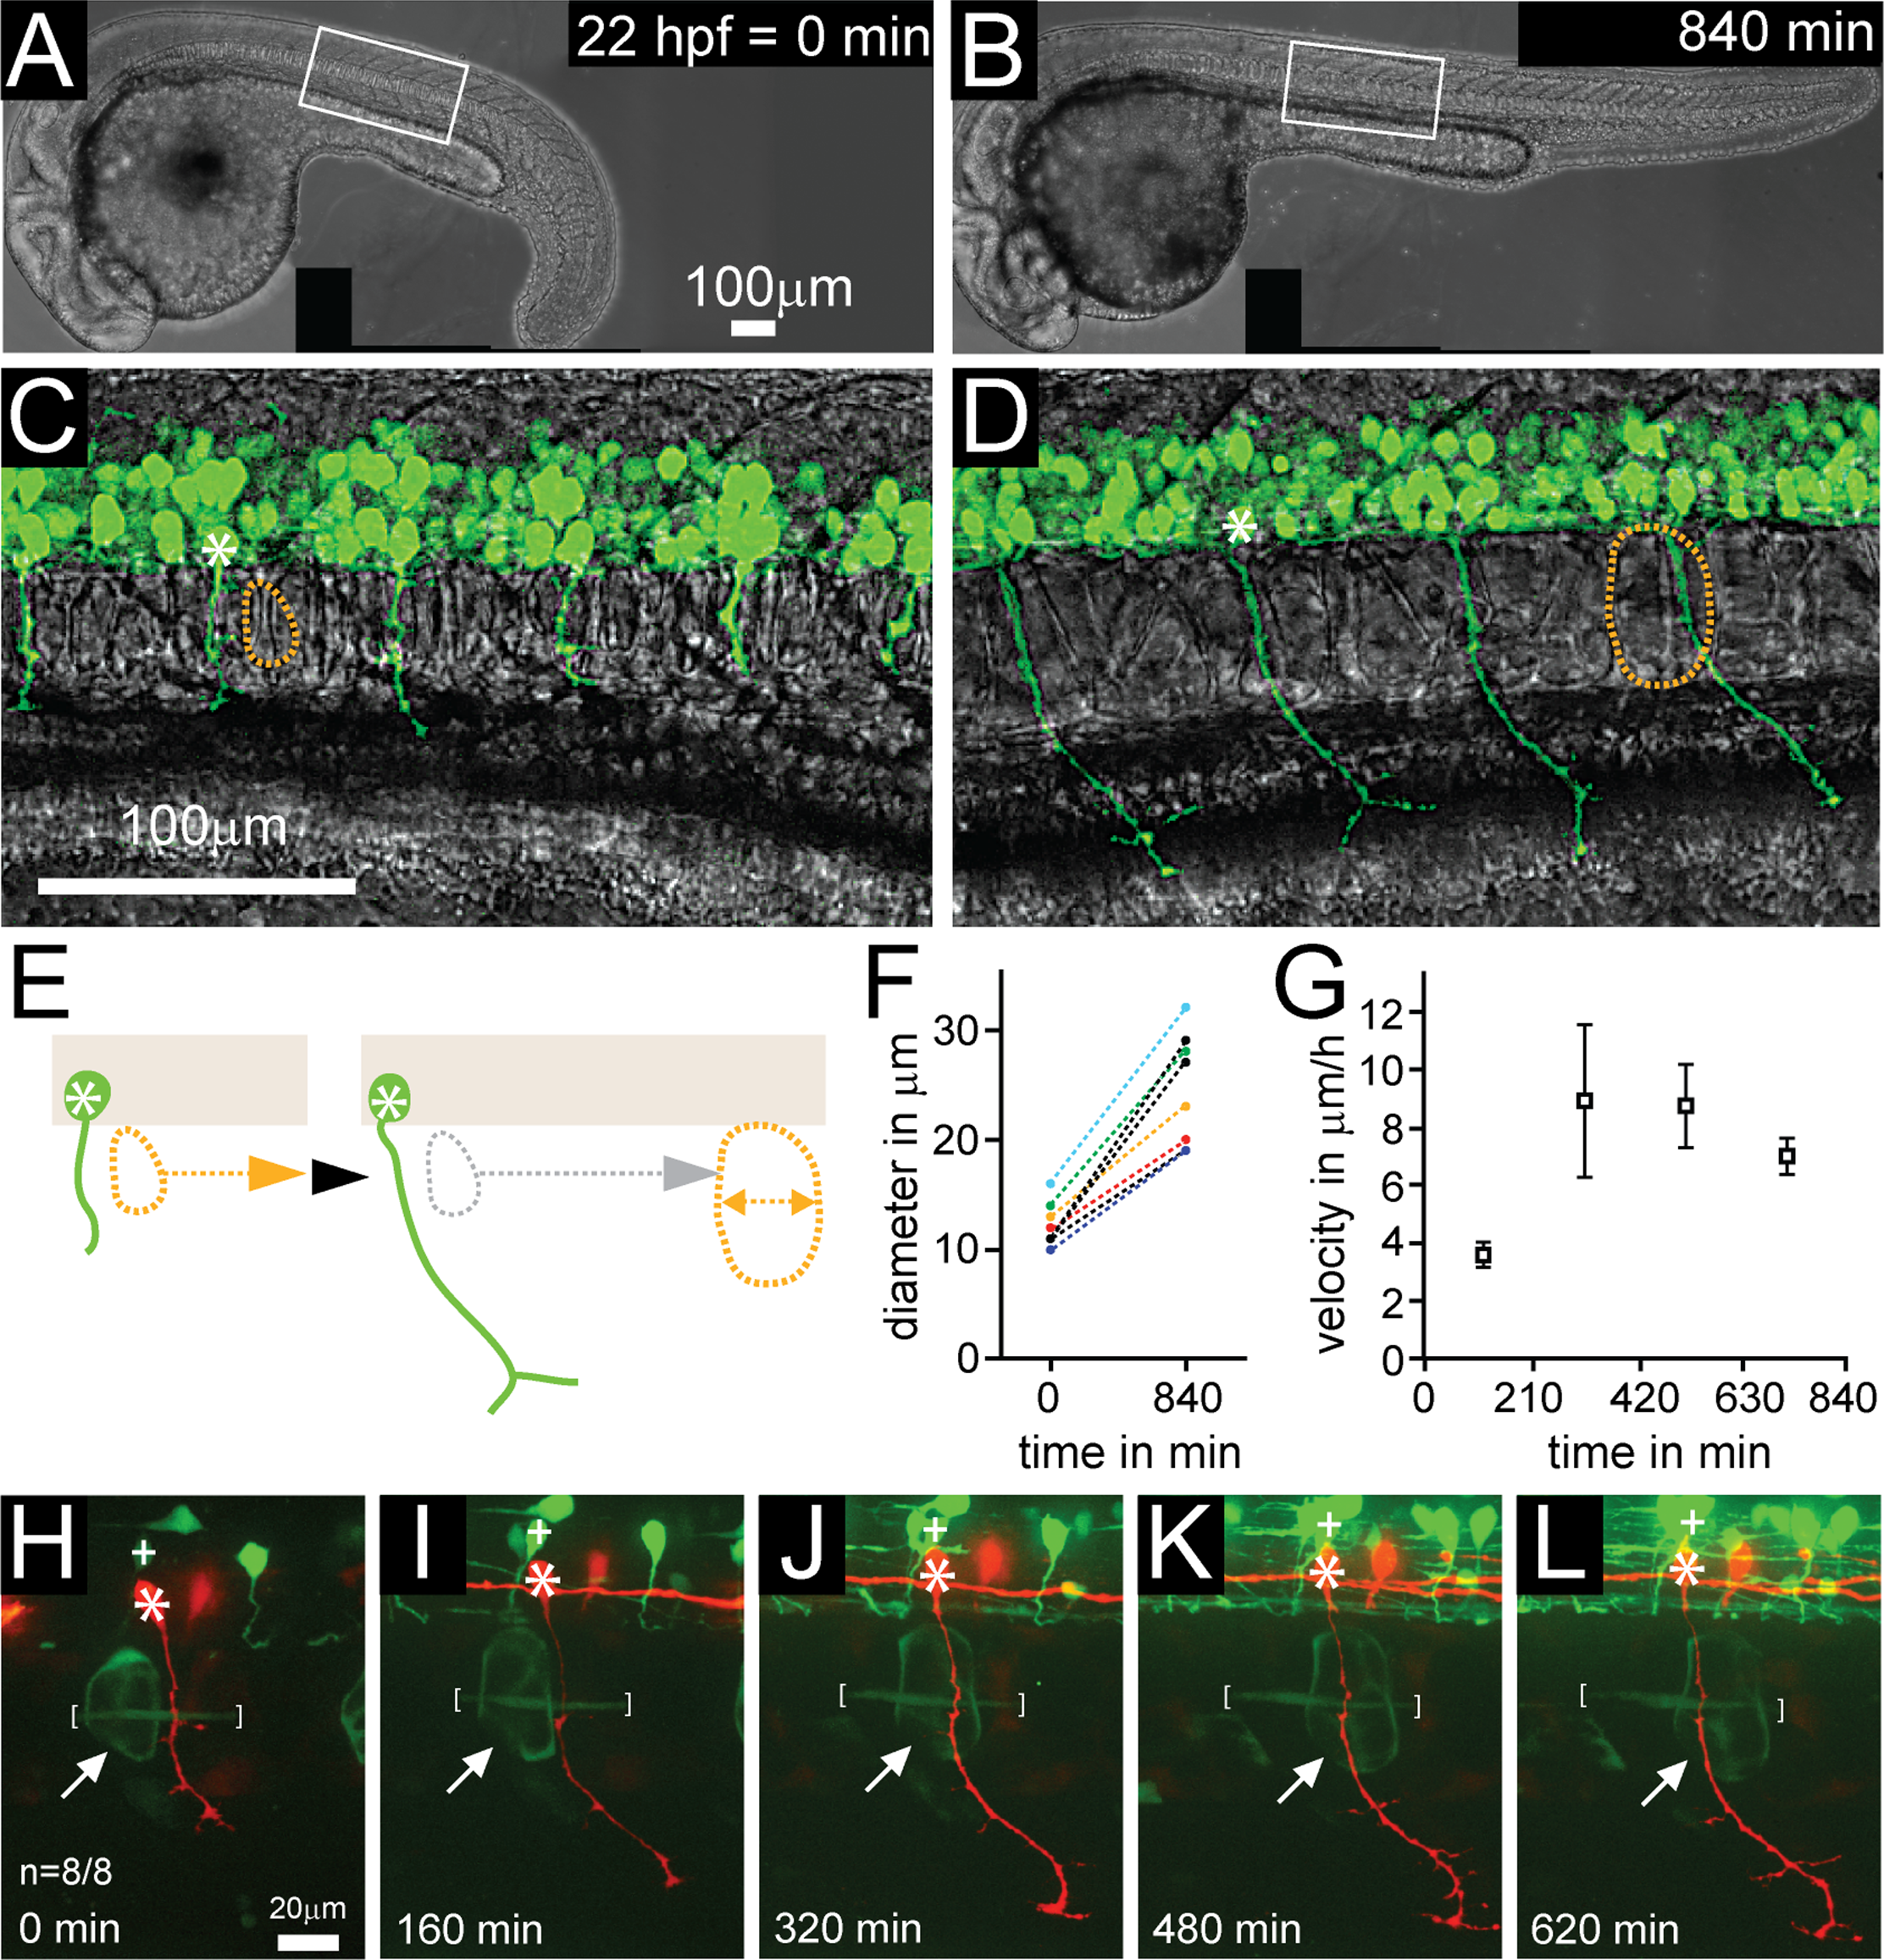
Fig. 1
Notochord cell expansion and shift during motor axon outgrowth.
(A-D) Time-lapse of a developing zebrafish embryo with transgenic expression of GFP in motoneurons (mnx1:GFP), starting at 22 hpf for 840 min. (A, B) Low magnification bright field images, generated by stitching together several images. (C, D) Higher magnification images of approximately the boxed areas in A (different embryos), in brightfield and GFP, generated by overlaying substacks containing motor neurons and notochord cells, respectively. While the embryo grows and axons are extending, there is a progressive posterior shift of an ‘identified’ notochord cell (outlined by dashed yellow circle) relative to a GFP positive CaP motoneuron (white asterisk). (E) Schematics of this shift. Note that as CaP motor axons (green) are extending and notochord cells (yellow dotted circle) shift posteriorly, the diameter of notochord cells increases, quantified in (F; n = 9). (G) Velocity of posterior shift of notochord cells relative to motor axons in μm/h over time (n = 6). Shift velocity is initially low and peaks between 210 and 630 min. (H-L) Time-lapse imaging of a CaP motoneuron labeled in red (mnx1:mKate) in Evx1:Gal4; UAS:GFP double transgenic embryos from 21 hpf until axons have fully extended to the ventral myotome (620 minutes). Note that an adjacent, GFP positive interneuron (+) and adjacent individual muscle fibers (white brackets) both stay aligned with the motoneuron. In contrast, individually labeled notochord cells (white arrow) shift progressively posteriorly compared to the labeled CaP motoneurons (n = 8/8). See also S1 Movie.