
IMAGE
Fig. 5
Image
|
Figure Caption
Fig. 5
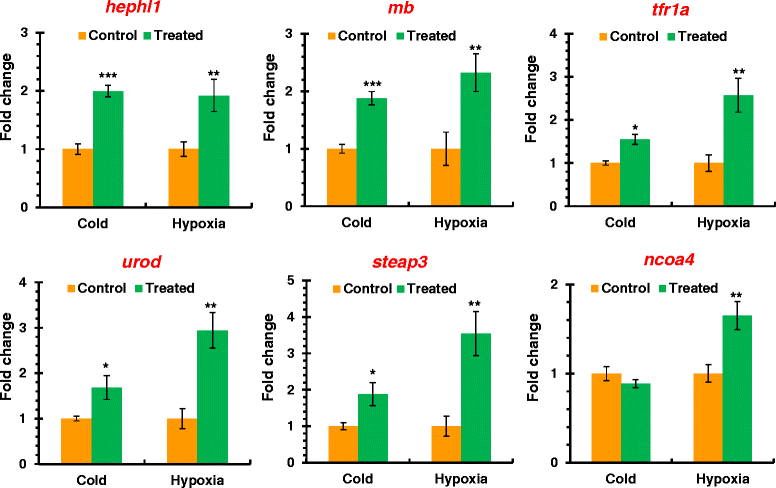
Genes co-induced by hypoxia and cold. The expression of genes in zebrafish larvae after hypoxia and cold pre-acclimation was characterized using qPCR. Data was shown as mean ± standard deviation (n = 3). Significant differences between control and hypoxia or cold exposed samples were demonstrated using asterisks. “*” p < 0.05, “**” p < 0.01 and “***” p < 0.001.
Figure Data
Acknowledgments
This image is the copyrighted work of the attributed author or publisher, and
ZFIN has permission only to display this image to its users.
Additional permissions should be obtained from the applicable author or publisher of the image.
Full text @ BMC Genomics