
|
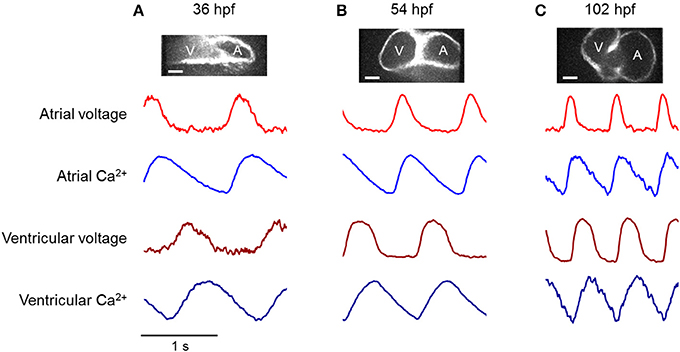
Fig. 4
Figure 4. Voltage and calcium transients of the atrium and ventricle in an embryonic zebrafish heart during development. Top: Fluorescence images of zebrafish hearts expressing CaViar showed transition of the heart tube into two chambers. Scale bars 50 μm. Bottom: Dual-wavelength imaging of CaViar reported voltage (red), and calcium (blue) transients in the atrium (lighter shade) and ventricle (darker shade) at (A) 36 hpf, (B) 54 hpf, (C) 102 hpf. At 36 hpf, low expression of Arch(D95N) led to higher noise than at other time-points. Blue illumination intensity was minimized at all time-points to minimize photo-inactivation of blebbistatin. This occasionally led to increased noise in the GCaMP5G fluorescence (e.g., at 102 hpf).