
Fig. 1
- ID
- ZDB-IMAGE-161206-17
- Genes
- Publication
- Smith et al., 2014 - Contact-Mediated Inhibition Between Oligodendrocyte Progenitor Cells and Motor Exit Point Glia Establishes the Spinal Cord Transition Zone
- All Figures
- Figures for Smith et al., 2014
|
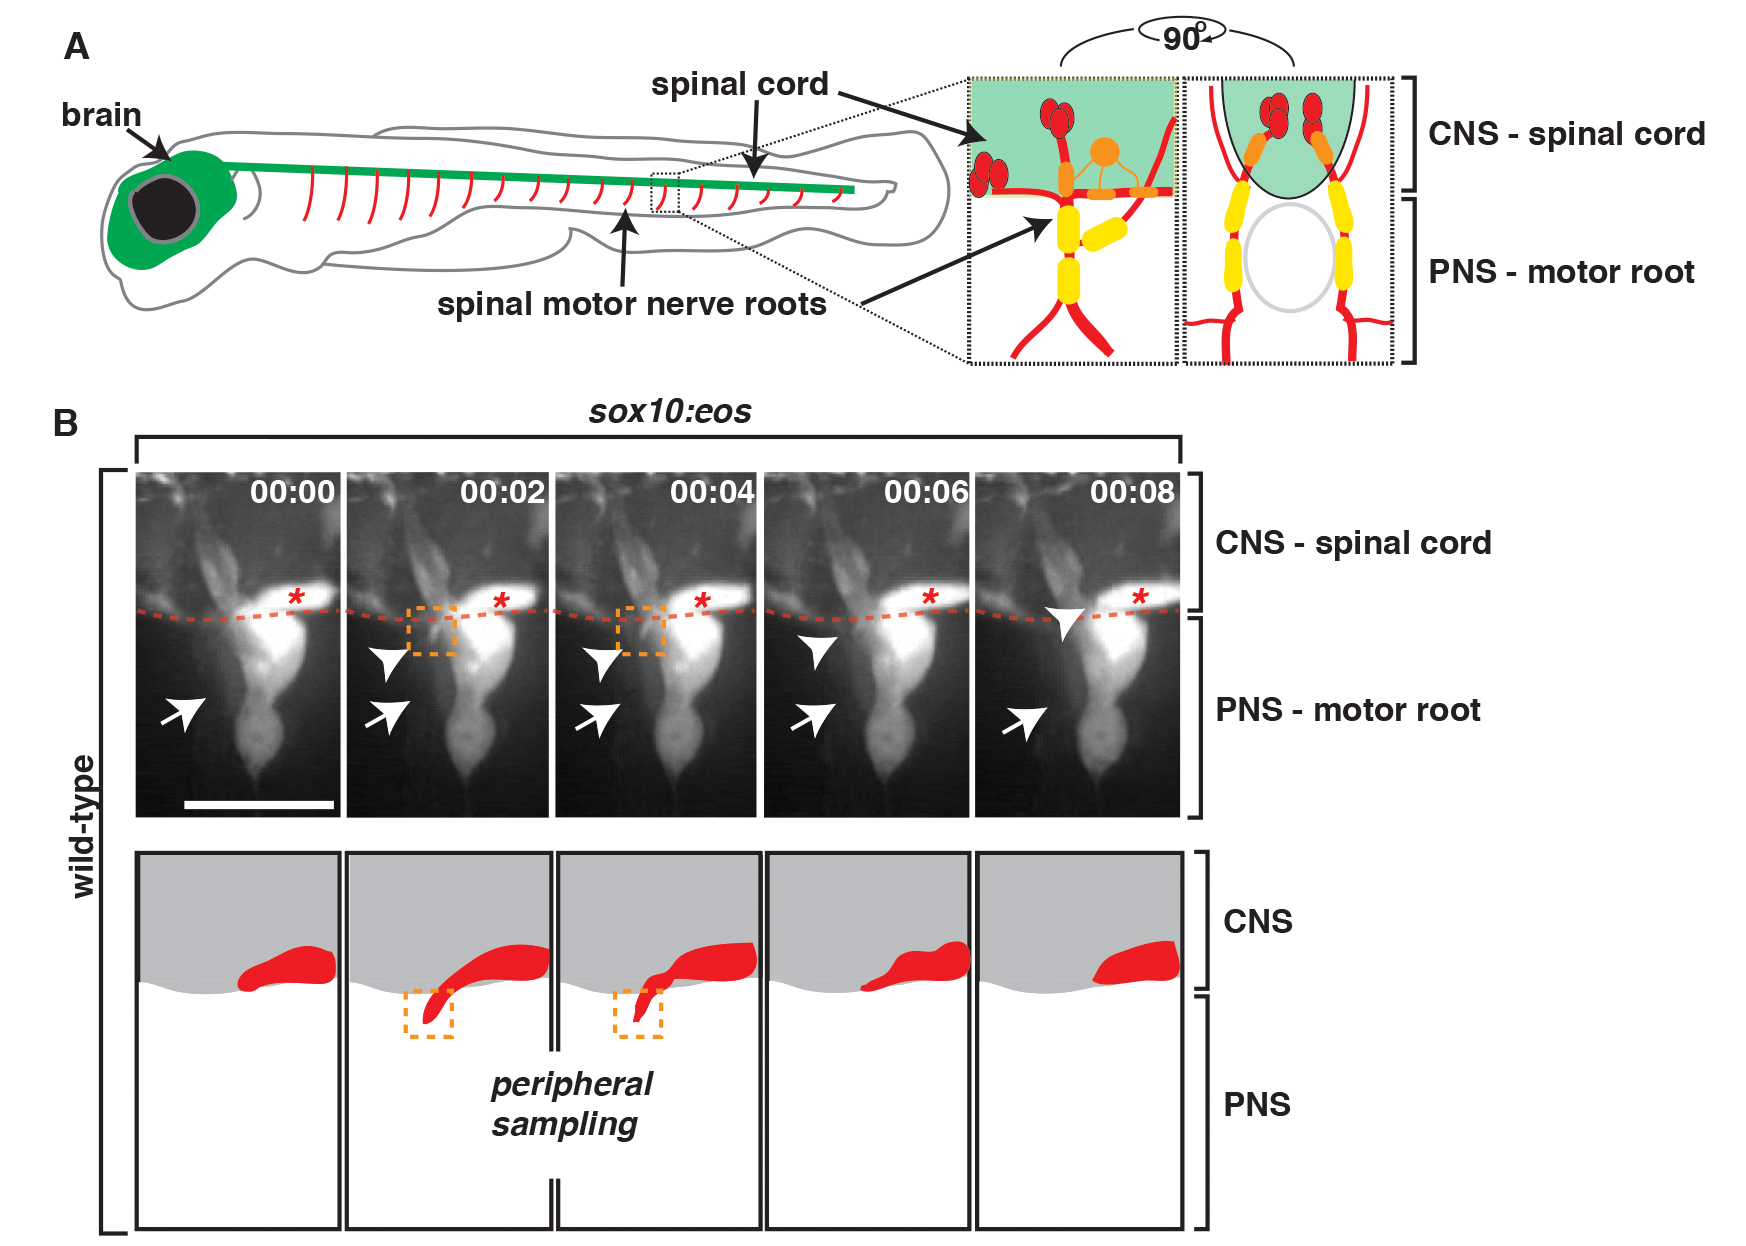
Fig. 1
PNS glia restrict OPC membrane processes in the PNS.
(A) Schematic of zebrafish spinal motor roots showing the CNS (green) consisting of the spinal cord and brain and the PNS (red). Insets show zoomed representations of a single spinal motor nerve root with motor axons (red), OPCs (orange), and PNS glia (yellow). Lateral and cross-section views are shown. (B) Frames captured from a 14-h time-lapse video beginning at 58 hpf in a Tg(sox10:eos) embryo. Numbers in upper right corners denote time lapsed from the first frame of the figure. (A) At approximately 68 hpf (00:00), peripheral glial cells (arrow) and OPCs (asterisk) can be seen. Just 2 min later (00:02), an OPC process (arrowhead/orange box) extended out of the spinal cord, contacted the motor root glial cell (arrow), and quickly retracted, all within 6 min. Traced schematic below shows spinal cord (grey) and OPC (red), at the corresponding times. All images are lateral views of the motor and sensory root with dorsal to the top and anterior to the left. Scale bar, 15 µm.