
Image
|
Figure Caption
Fig. 4
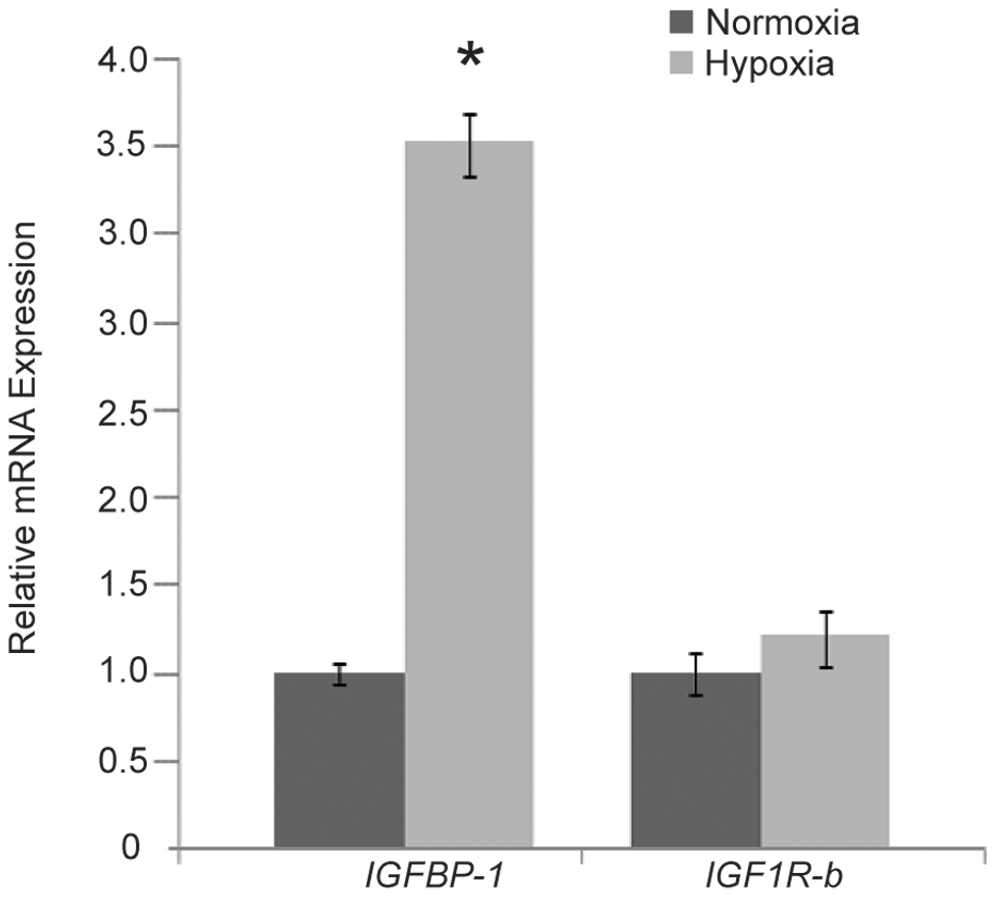
Hypoxia induces IGFBP-1 mRNA expression in zebrafish embryos at prim-5 stage.
Expression levels of IGFBP-1 mRNA and IGF1R-b mRNA were quantified using real-time PCR and normalized against 18S rRNA. Data are the mean relative fold changes ± SE (n = 10) with respect to the control (normoxia) level (arbitrarily set to 1). Significantly higher IGFBP-1 mRNA expression was found in hypoxic embryos as compared with normoxic embryos. No significant difference in IGF1R-b mRNA expression was found between normoxic and hypoxic embryos. * denotes p<0.05.
Figure Data
Acknowledgments
This image is the copyrighted work of the attributed author or publisher, and
ZFIN has permission only to display this image to its users.
Additional permissions should be obtained from the applicable author or publisher of the image.
Full text @ PLoS One