
Fig. 5
|
Fig. 5
Global gene expression analysis reveals SUV39H1 may act through aberrant cell cycle regulation.
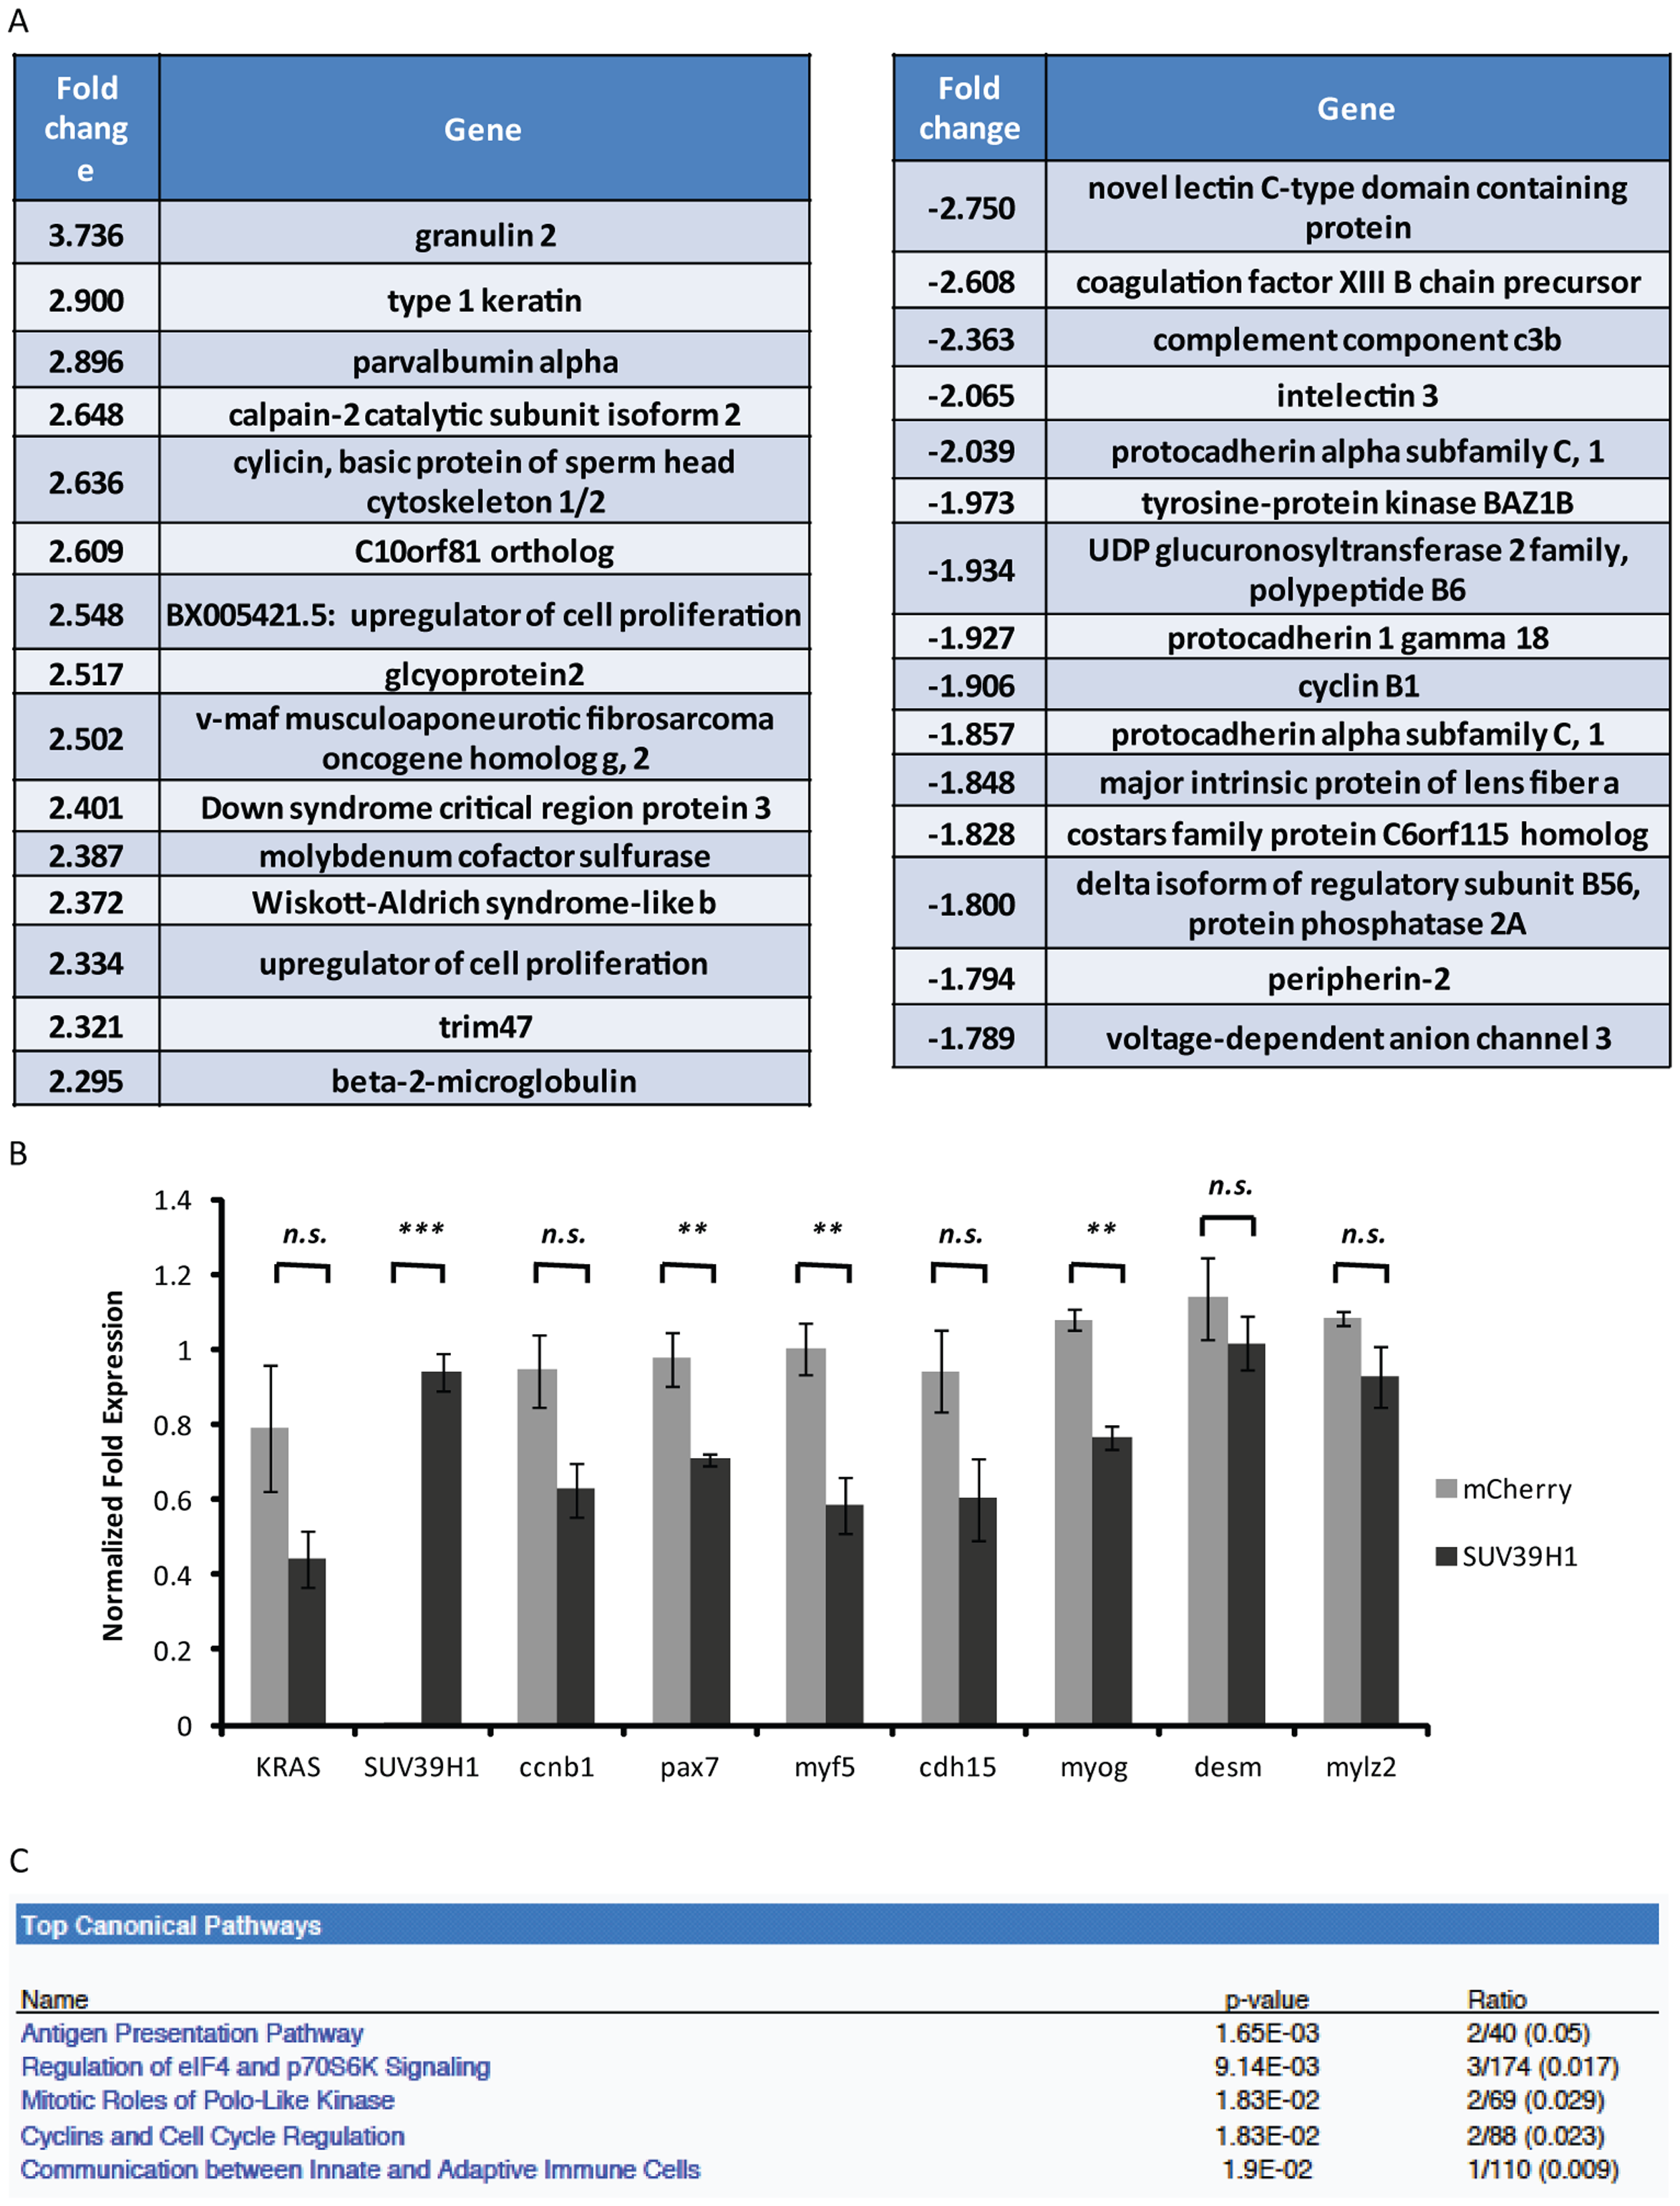
(A) Table of top up- and downregulated annotated genes in rag2-KRASG12D, rag2-SUV39H1 7 dpf larvae as compared to rag2-KRASG12D, rag2-mCherry control larvae. Of particular interest was cyclin B1. (B) Gene expression analysis by qPCR in rag2-KRASG12D, rag2-SUV39H1 7 dpf larvae as compared to rag2-KRASG12D, rag2-mCherry control larvae, all mylz2-GFP positive. Cyclin B1 downregulation was approaching significance, confirming the microarray analysis (p = 0.0553). As expected, SUV39H1 levels differ between the larvae, but KRAS levels do not, suggesting SUV39H1 is not simply downregulating KRAS to suppress tumor formation (SUV39H1 p<0.0001; KRAS p = 0.1284). SUV39H1 may also have an impact on some muscle differentiation genes at this stage of tumor development (pax7 p = 0.0230; myf5 p = 0.0143; cdh15 p = 0.0922; myog p = 0.0017; desm p = 0.4098; mylz2 p = 0.1311). (C) Ingenuity Pathway Analysis of top canonical pathways affected based on the 7 dpf microarray list. Of the top five pathways impacted, two involve cell cycle regulators.