
|
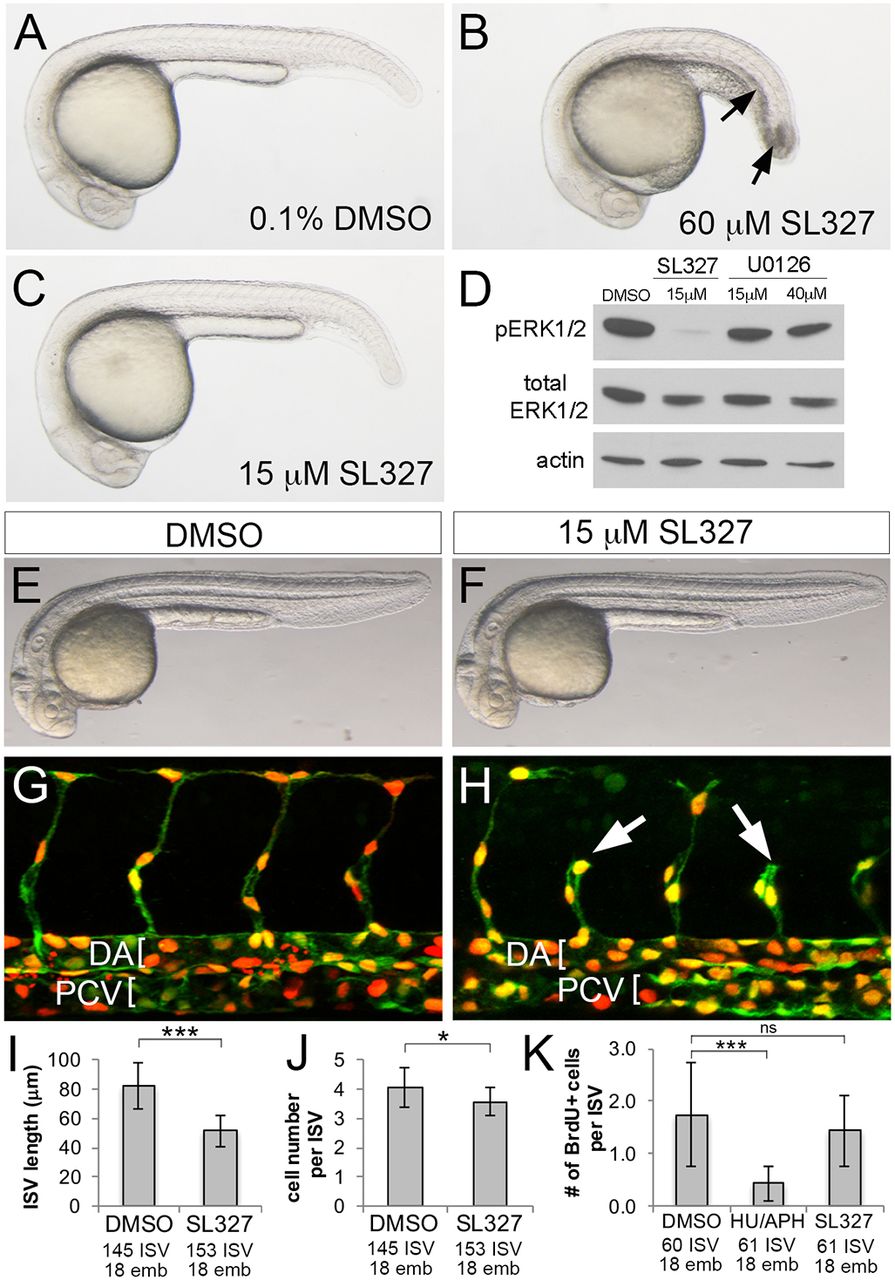
Fig. 3
Chemical inhibition of ERK blocks ISV sprouting. (A-C) Transmitted light images of embryos treated with the indicated compound and concentration from 10 hpf to 24 hpf. Arrows in B indicate necrosis. (D) Western blot analysis of pERK, total ERK and actin in embryos treated from 24 to 25 hpf as indicated. (E-H) Transmitted light images (E,F) and confocal images (G,H) of Tg(cdh5:gal4ff)mu101;(uas:nTom)um152;(uas:egfp)nkuasgfpa1 embryos at 32 hpf. Embryos were treated with 0.1% DMSO (E,G) or 15 µM SL327 (F,H) from 20 to 32 hpf. DA and PCV are denoted by brackets in G,H and shorter ISVs are indicated by arrows in H. (I-K) Quantification of ISV length (I), cell number per ISV (J) and BrdU-positive cells per ISV (K) following treatment with the indicated compound. *P<0.05, ***P<0.001; ns, not statistically significant; numbers of ISVs and embryos counted across three experiments are indicated on the x-axis. Error bars represent s.d.