
|
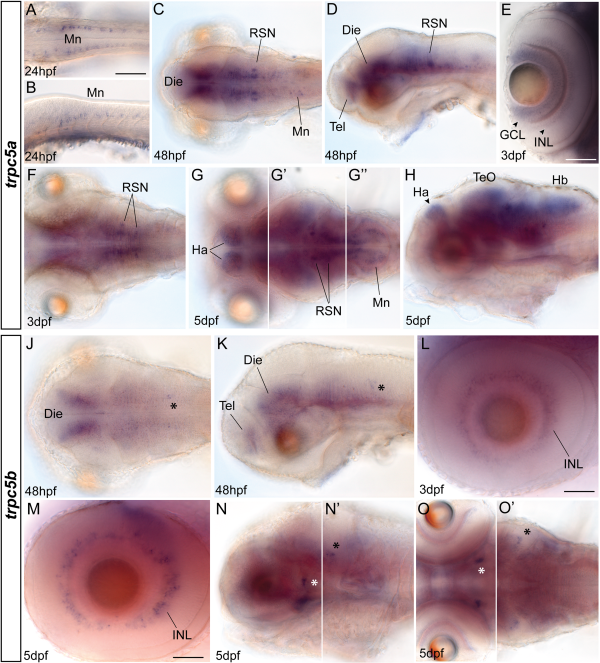
Fig. 6
A-O: Transcript distribution of trpc5a (A-H) and trpc5b (J-O). A,B: Dorsal (A) and lateral (B) views on the hindbrain region of 24 hr postfertilization (hpf) embryos. C,D: trpc5a expression in brain regions and spinal cord of zebrafish 48 hpf shown dorsally (C) and laterally (D). E: Retinal expression in 3 days postfertilization (dpf) larvae, anterior is up. F: Dorsal view on hindbrain region showing expression in reticulospinal neurons (RSNs) at 3 dpf. G,H: Dorsal (G) and lateral (H) views on 5 dpf larvae with G, G2 and G3 showing different focal planes. J,K: Expression of trpc5b in the diencephalon and hindbrain. J and K show dorsal and lateral views, respectively. L,M: Lateral views on retinal trpc5b expression. N,O: Lateral (N) and dorsal (D) views of whole-mount in situ staining with white asterisks labeling midbrain cells expressing trpc5b 5 dpf. Prime images show different focal planes of the same larvae as in N and O, respectively. Black asterisks in J, K, N′, and O′ mark trpc5b-expressing cell clusters in the hindbrain. Die, diencephalon; GCL, ganglion cell layer; Ha, habenula; Hb, hindbrain; INL, inner nuclear layer; Mn, motoneurons; Tel, telencephalon; TeO, optic tectum. Scale bar = 100 µm in A (for all images without scale bar); 50 µm in E,L,M.