
|
Fig. 4
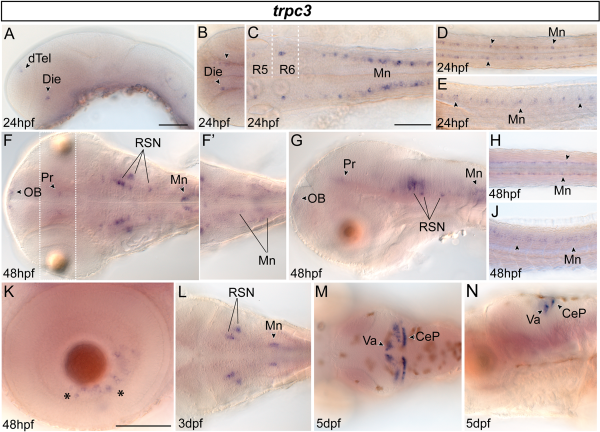
Dynamic trpc3 expression in zebrafish whole-mounts. A: Shows an embryo 24 hr postfertilization (hpf) expressing trpc3 in different forebrain clusters. B: The bilateral neural clusters in the diencephalon expressing trpc3 are shown from dorsal. C: Dorsal view of the hindbrain region. Dashed lines mark approximate boundaries of rhombomeres 5 and 6 (R5, R6). D,E: Dorsal (D) and lateral (E) views of zebrafish tail region 24 hpf with expression in motoneurons. F,G: Expression in the brain at 48 hpf. Dotted field in F shows the same embryo in a different focal plane. F′ depicts a more dorsal plane of the hindbrain region. H,J: trpc3 staining in motoneurons 48 hpf in dorsal (H) and lateral (J) views. K: Lateral view on retinal cells (asterisks) expressing trpc3 transiently around 48 hpf. L: Hindbrain expression of trpc3 in larvae 3 days postfertilization (dpf). M,N: Cerebellar cell clusters expressing trpc3 at 5 dpf shown in dorsal (M) and lateral (N) views. Anterior is always left. CeP, cerebellar plate; Die, diencephalon; dTel, dorsal telencephalon; Mn, motoneurons; OB, olfactory bulb; Pr, pretectum; RSN, reticulospinal neurons; Va, valvula cerebelli. Scale bar = 100 µm in A (for all pictures without scale bar), C,K.