
|
Fig. 2
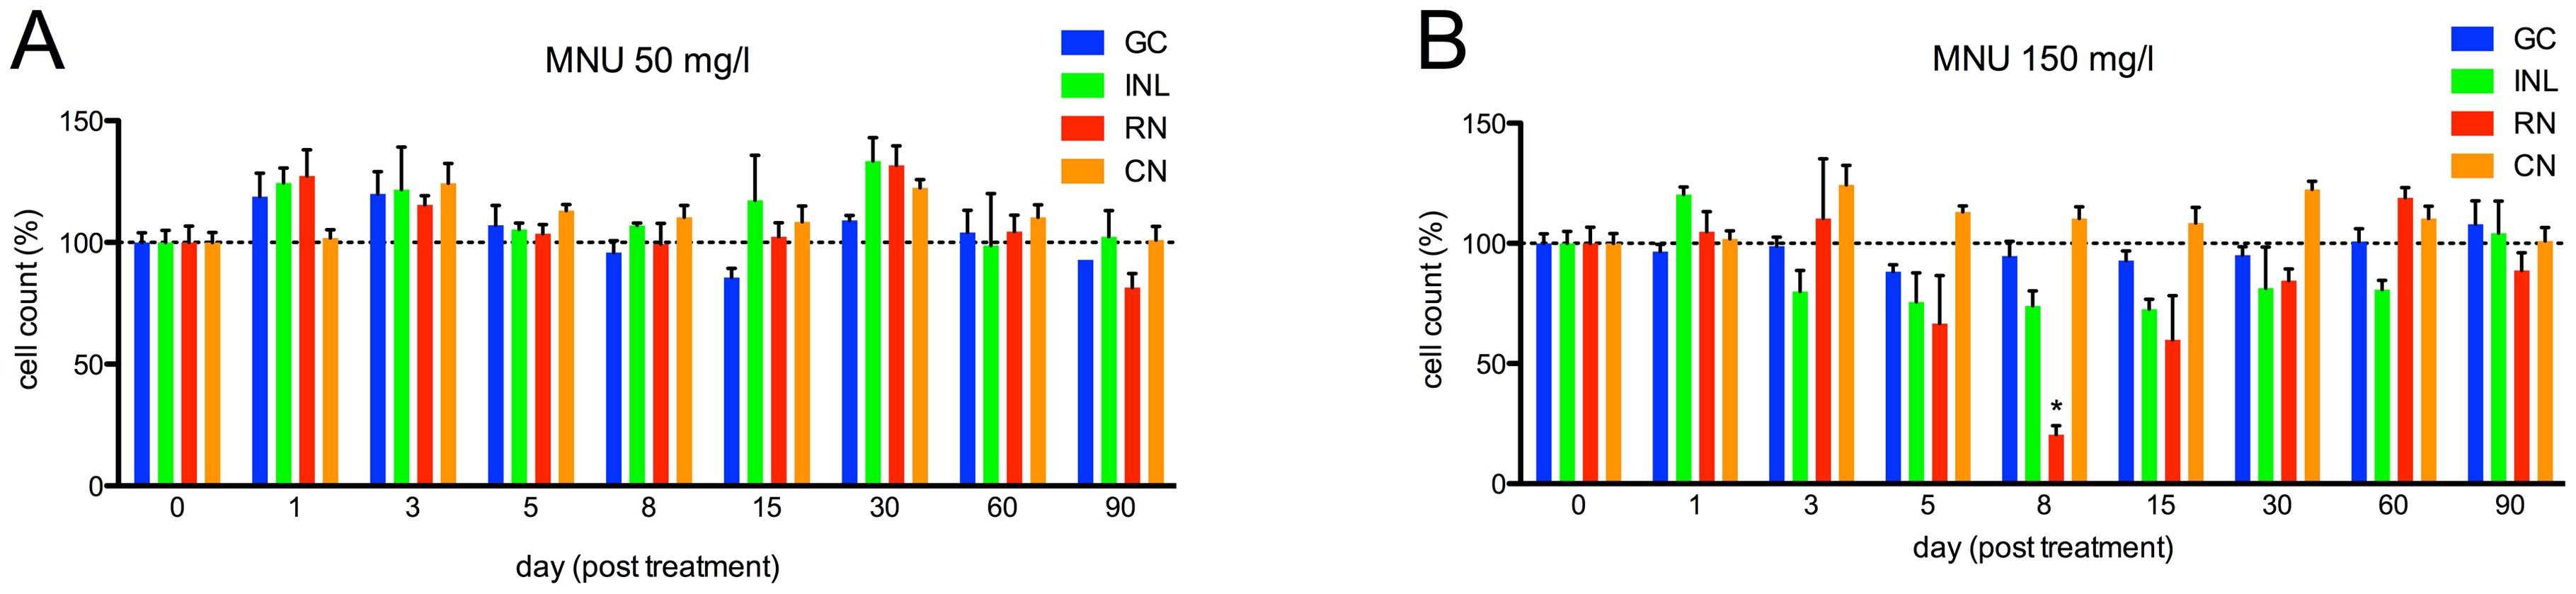
Cell counts in different retinal layers for zebrafish exposed to MNU at baseline and follow-up.
A. MNU 50 mg/l group: No relevant decrease in retinal cells was observed (p>0.05). B. MNU 150 mg/l group: Rod cell loss started at day 5; the number of rods was lowest at day 8 (pd0.01) with a decrease of 79.6%, but fully recovered by day 60. Other retinal layers did not display any relevant decrease of cell numbers after MNU exposure (p>0.05). GC (ganglion cells), INL (inner nuclear layer), RN (rod nuclei) and CN (cone nuclei). Baseline values are defined as 100%. Mean values with SEM error bars are represented (* indicates pd0.01 compared with day 0).