
Image
|
Figure Caption
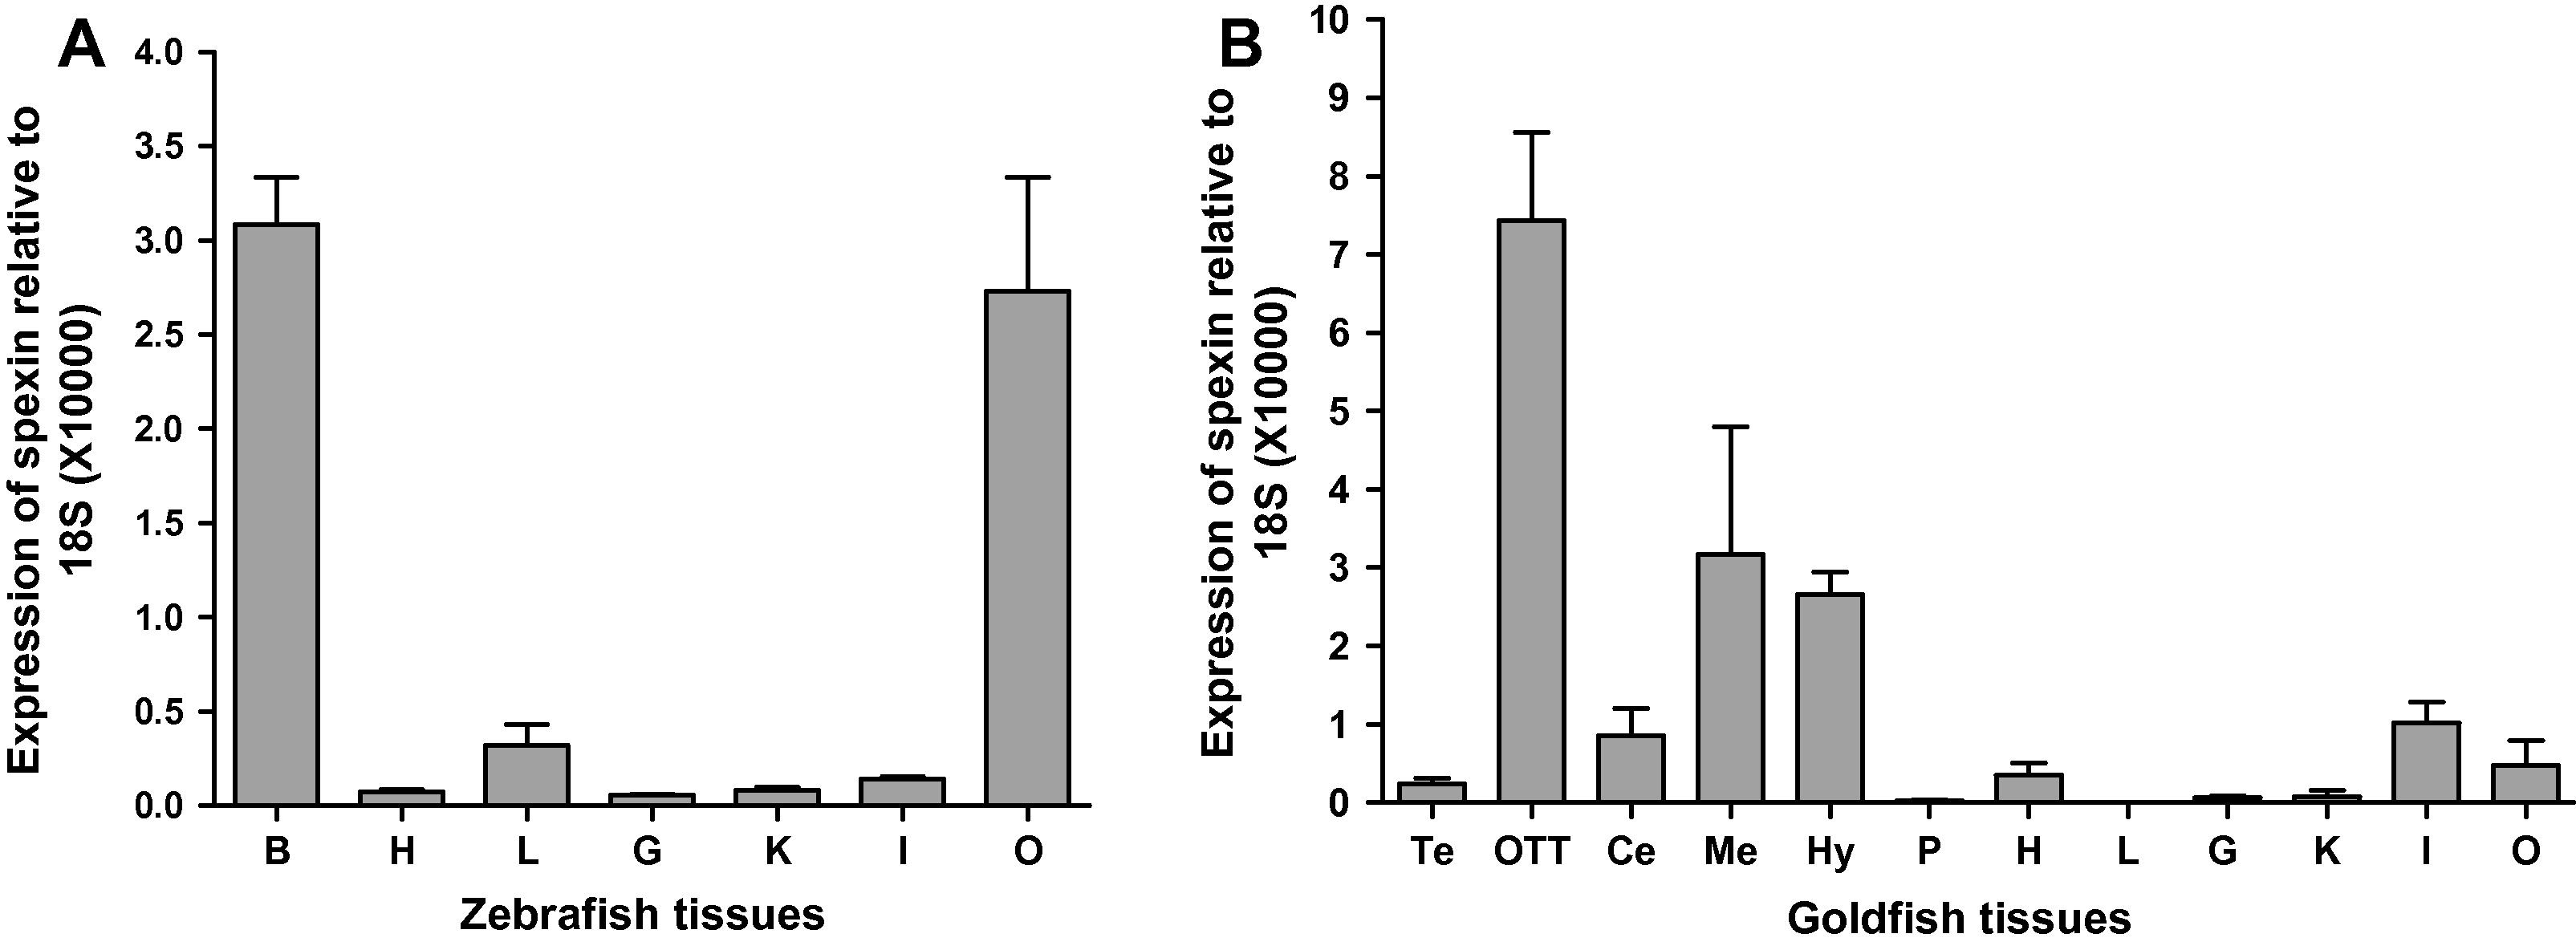
Fig. 3
Tissue expression of spexin in zebrafish and goldfish. (A) Real-time PCR analysis of spexin mRNA levels in different zebrafish tissues. (B) Real-time PCR analysis of spexin mRNA levels in different goldfish tissues. Spexin mRNA level from different tissues were normalized against 18 s transcripts. Data are expressed as mean values ± S.D. (n = 3). B, brain; Te: telencephalon; OTT: optic tectum thalamus; Ce, cerebellum; Me, medulla; Hy: hypothalamus; P: pituitary; H: heart; L: liver; K: kidney; G: gill; I, intestine; O: ovary.
Figure Data
Acknowledgments
This image is the copyrighted work of the attributed author or publisher, and
ZFIN has permission only to display this image to its users.
Additional permissions should be obtained from the applicable author or publisher of the image.
Reprinted from Molecular and Cellular Endocrinology, 374(1-2), Liu, Y., Li, S., Qi, X., Zhou, W., Liu, X., Lin, H., Zhang, Y., and Cheng, C.H., A novel neuropeptide in suppressing luteinizing hormone release in goldfish, Carassius auratus, 65-72, Copyright (2013) with permission from Elsevier. Full text @ Mol. Cell. Endocrinol.