
Image
|
Figure Caption
Fig. 5
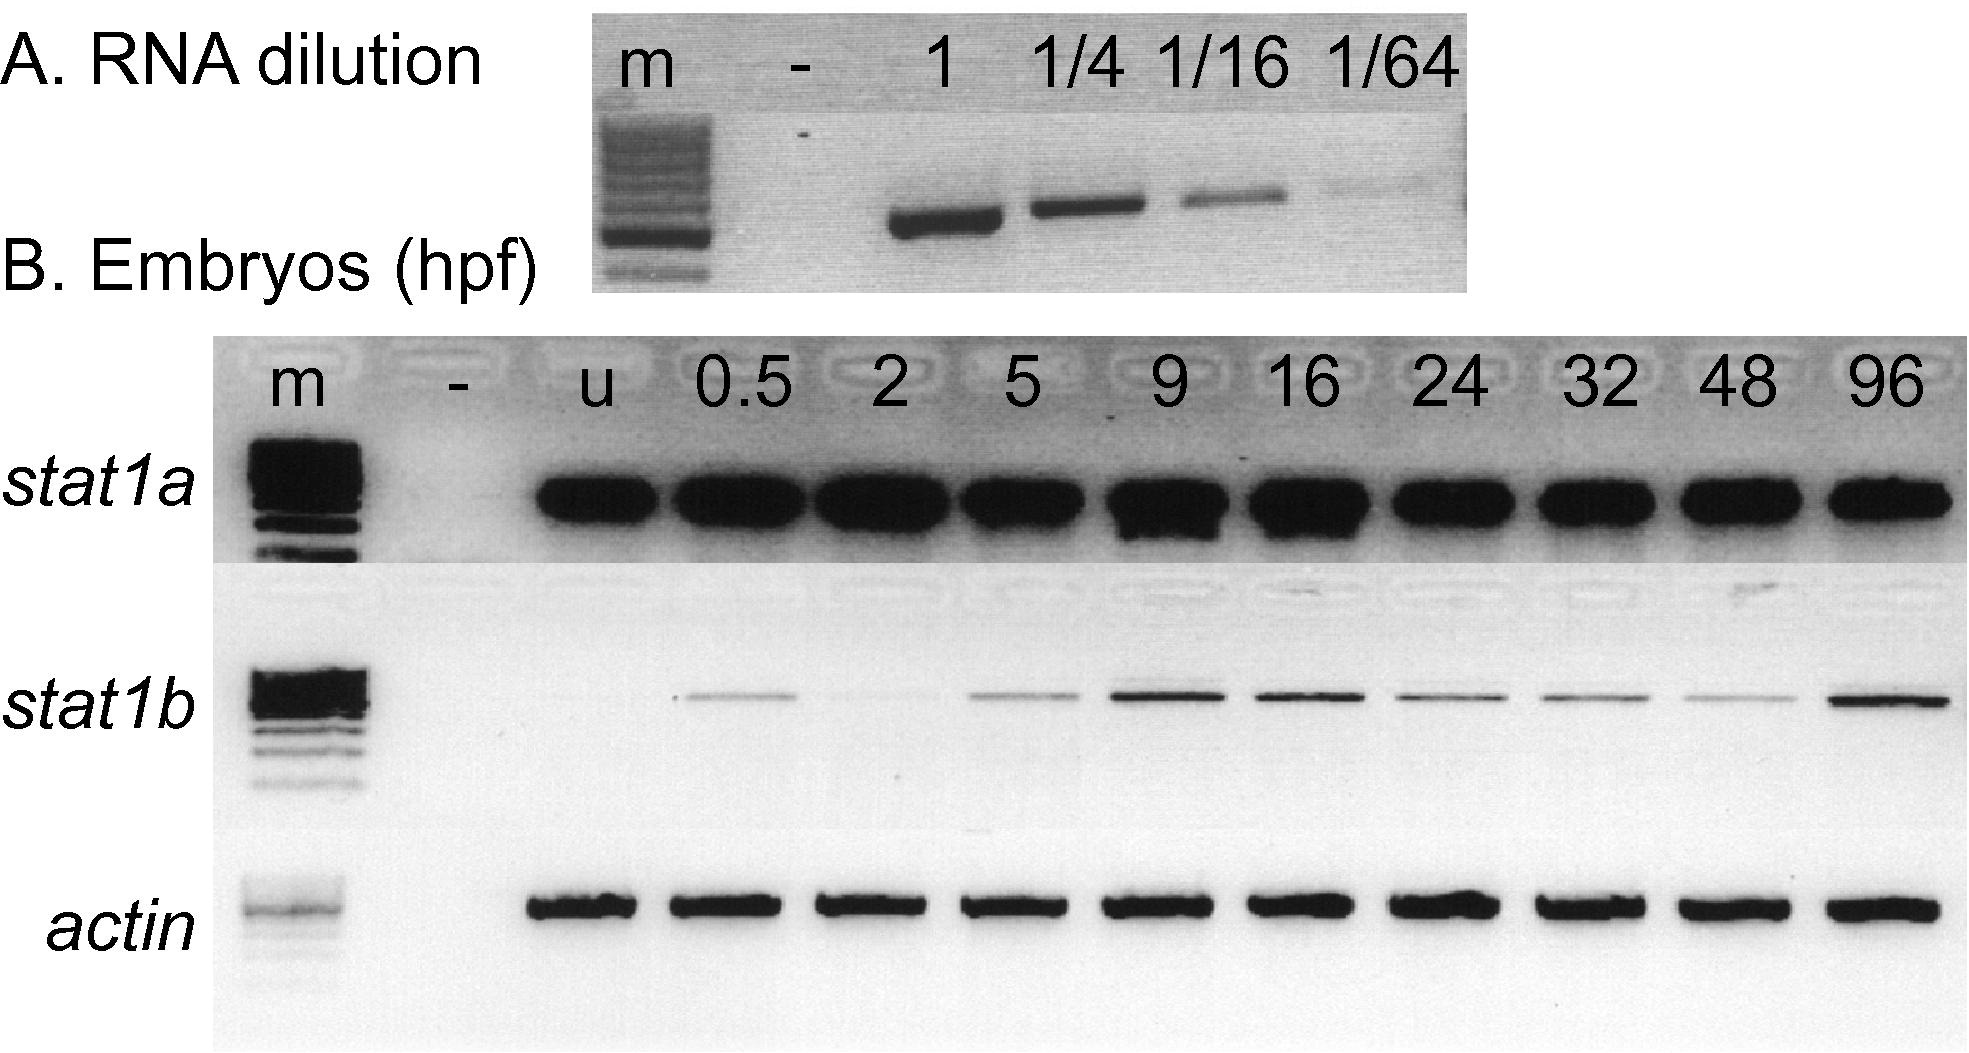
stat1 gene expression assayed by RT-PCR. A. Calibration series. A gradient of RNA dilutions and 21 amplification cycles with stat1b primers verified a semi-quantitative analysis of target mRNAs. B. Detection of stat1a and stat1b expression using RT-PCR at various stages of development using beta actin expression as loading control. RNA samples were extracted from zebrafish embryos at the indicated ages. Abbreviations: -, negative control with no RNA added; u, unfertilized eggs; 0.5, 2, etc., ages at hours post fertilization (hpf).
Figure Data
Acknowledgments
This image is the copyrighted work of the attributed author or publisher, and
ZFIN has permission only to display this image to its users.
Additional permissions should be obtained from the applicable author or publisher of the image.
Reprinted from Mechanisms of Development, 128(7-10), Song, H., Yan, Y.L., Titus, T., He, X., and Postlethwait, J.H., The role of stat1b in zebrafish hematopoiesis, 442-56, Copyright (2011) with permission from Elsevier. Full text @ Mech. Dev.