
IMAGE
Fig. 12
Image
|
Figure Caption
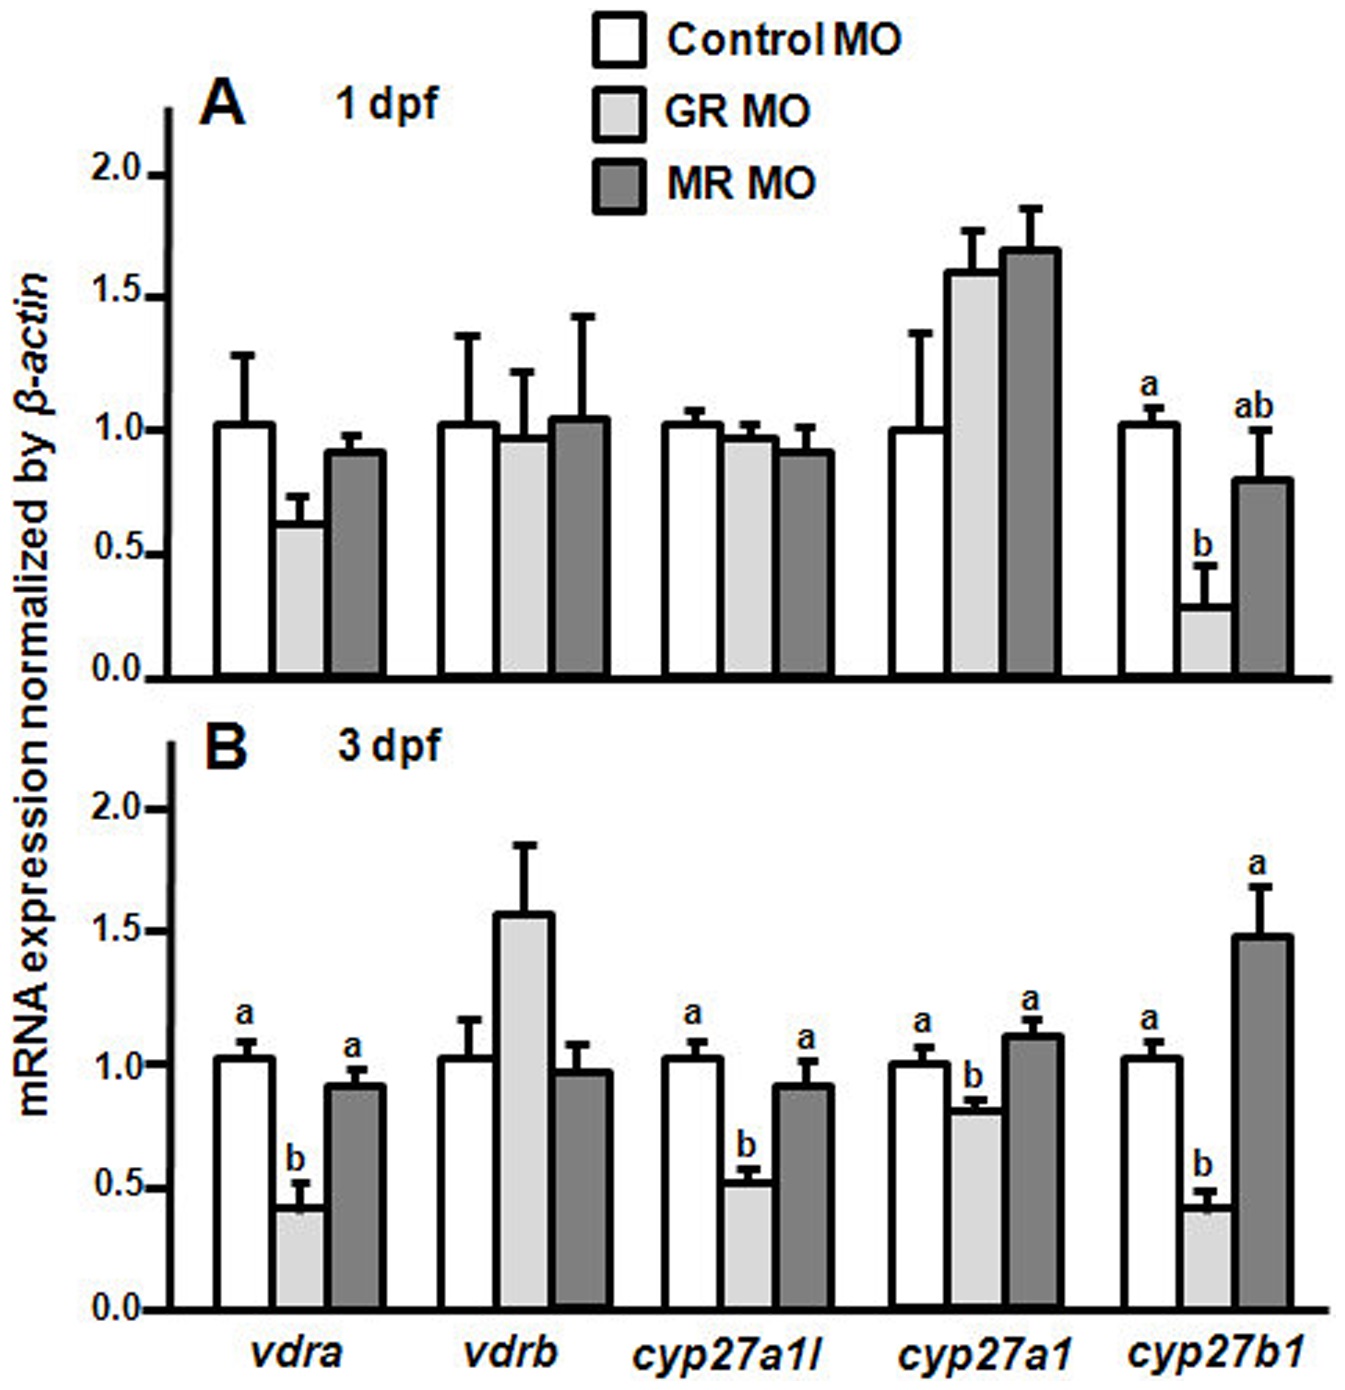
Fig. 12
Effects of MR MO and GR MO on mRNA expression of the vitamin D3-related genes.
(A) mRNA expressions in 1-dpf zebrafish embryos. (B) mRNA expressions in 3-dpf zebrafish embryos. mRNA expression was analyze by qPCR and values were normalized to β-actin. abcIndicate a significant difference (p<0.05) using Tukey′s multiple-comparison test following one-way ANOVA. Values are the mean ± SEM (n = 6).
Figure Data
Acknowledgments
This image is the copyrighted work of the attributed author or publisher, and
ZFIN has permission only to display this image to its users.
Additional permissions should be obtained from the applicable author or publisher of the image.
Full text @ PLoS One