
Image
|
Figure Caption
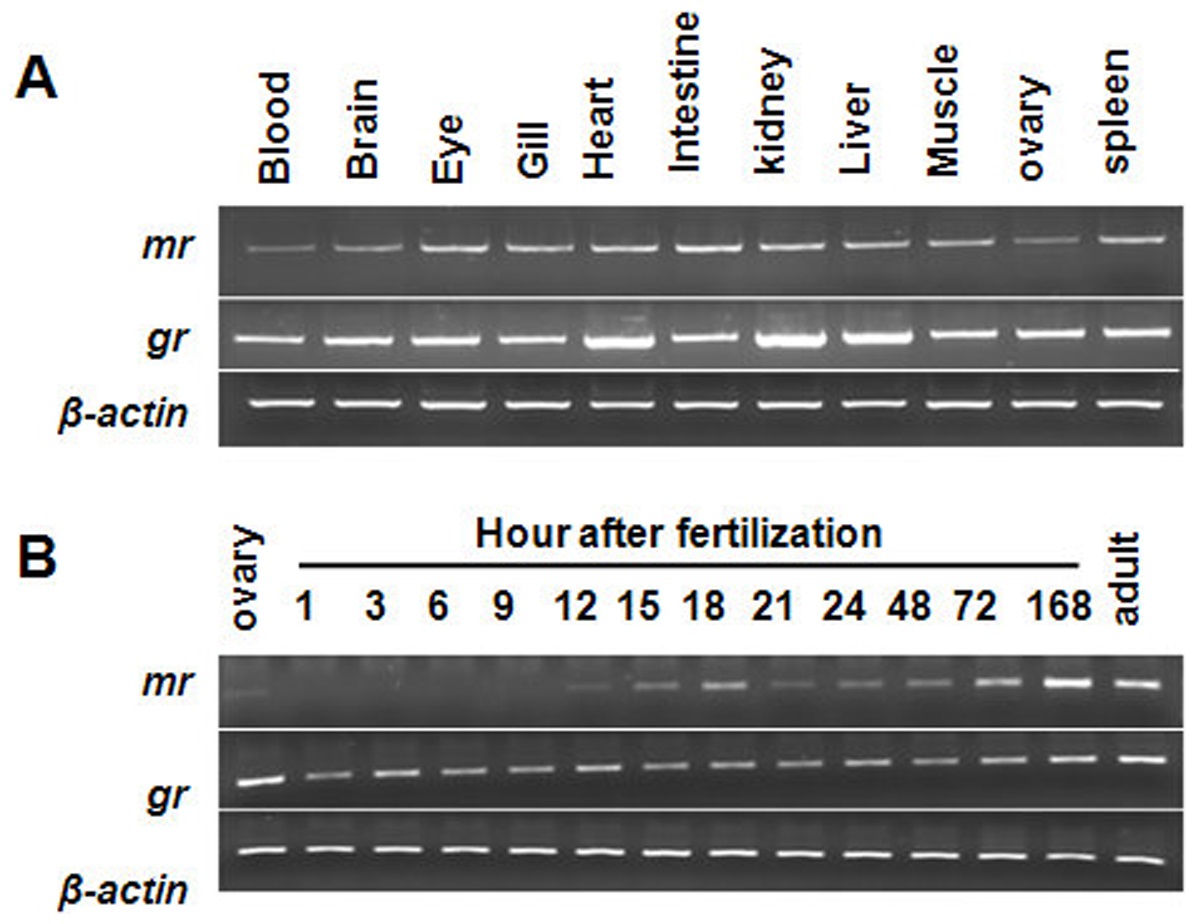
Fig. 1
Zebrafish mr and gr expression profiles.
Determined by RT-PCR, mr and gr mRNA in various tissues of adults (A), and during developmental stages of embryos (B). β-actin was used as the internal control.
Figure Data
Acknowledgments
This image is the copyrighted work of the attributed author or publisher, and
ZFIN has permission only to display this image to its users.
Additional permissions should be obtained from the applicable author or publisher of the image.
Full text @ PLoS One