
Image
|
Figure Caption
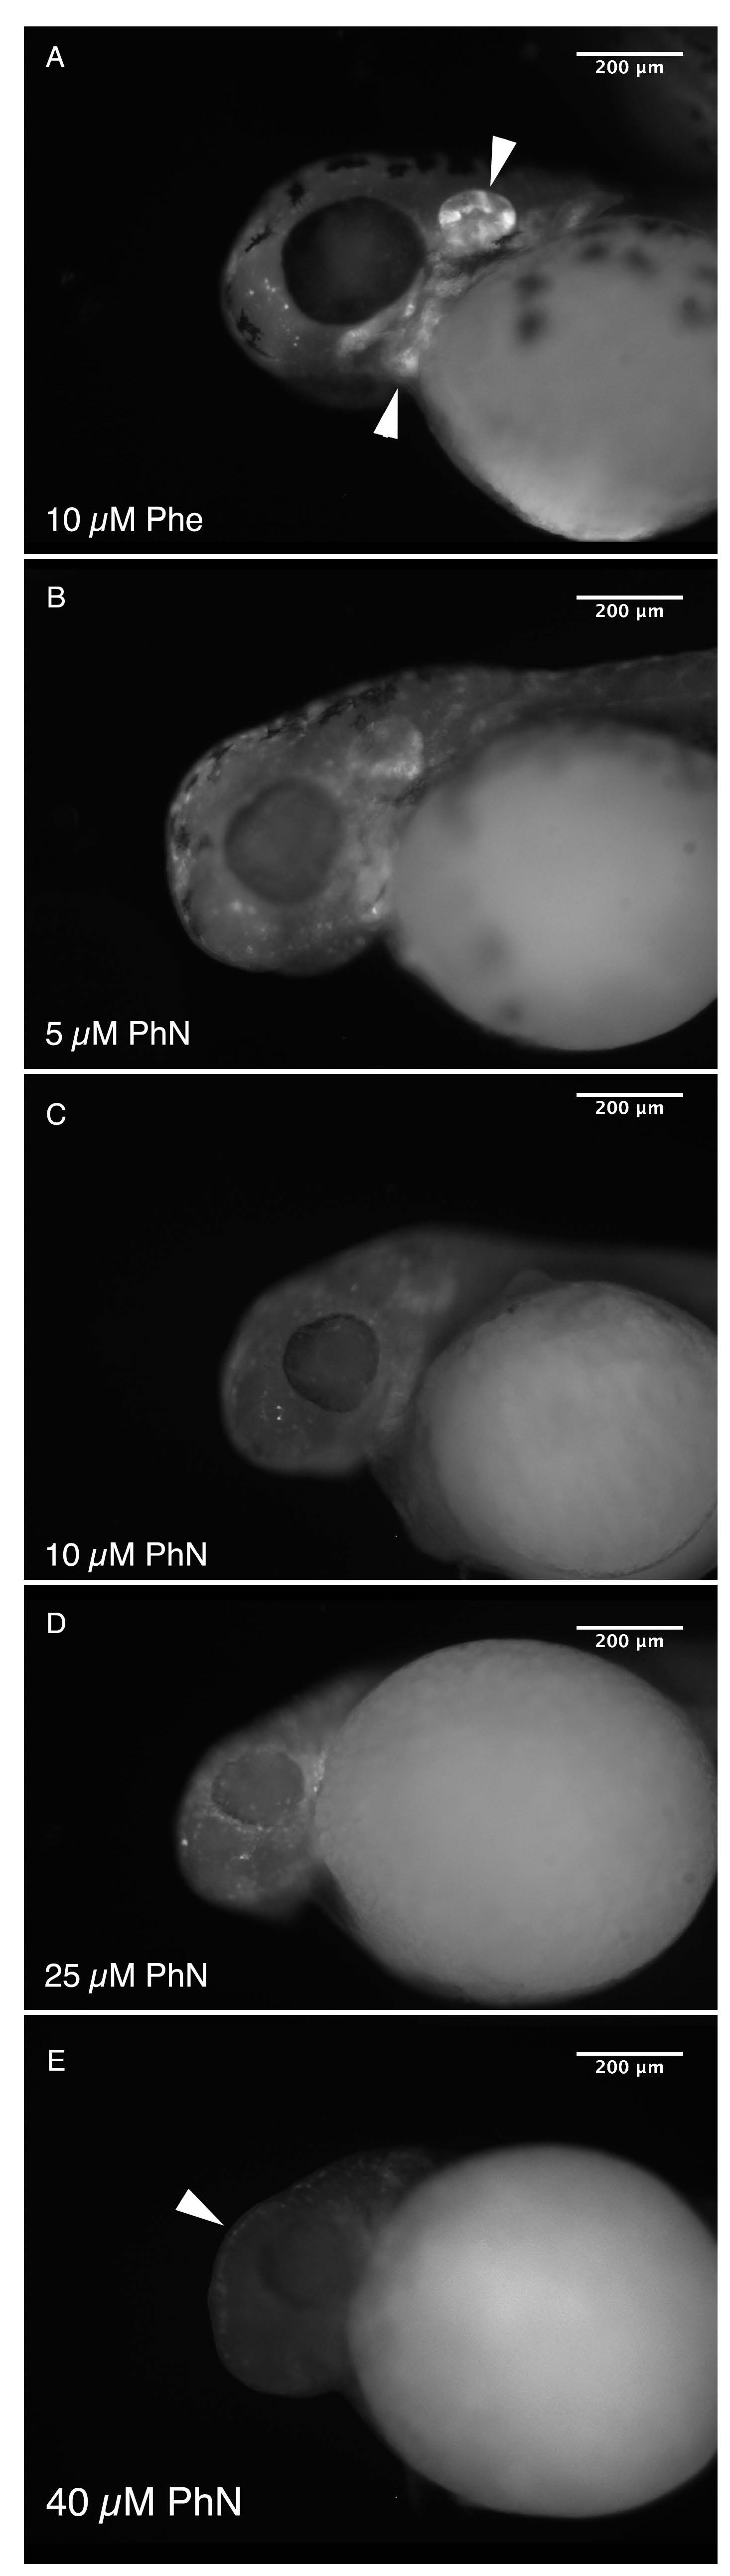
Fig. 5
PhN disrupts craniofacial neural crest. (A) Epifluorescence micrograph of the head of a 48 hpf Tg(sox10a:eGFP) embryo treated from 24 hpf with 10 µM PhE showing normal development of the craniofacial neural crest (arrowheads indicate the otic vesicle and jaw cartilage). Embryos treated with: (B) 5; (C) 10; (D) 25; and (E) 40 µM PhN, exhibiting progressively more severe defects in these structures. Arrowhead in (E) indicates presumptive pigment cells trapped below the epidermis. Scale bars are 200 µm.
Acknowledgments
This image is the copyrighted work of the attributed author or publisher, and
ZFIN has permission only to display this image to its users.
Additional permissions should be obtained from the applicable author or publisher of the image.
Full text @ Int. J. Mol. Sci.