
|
Fig. S6
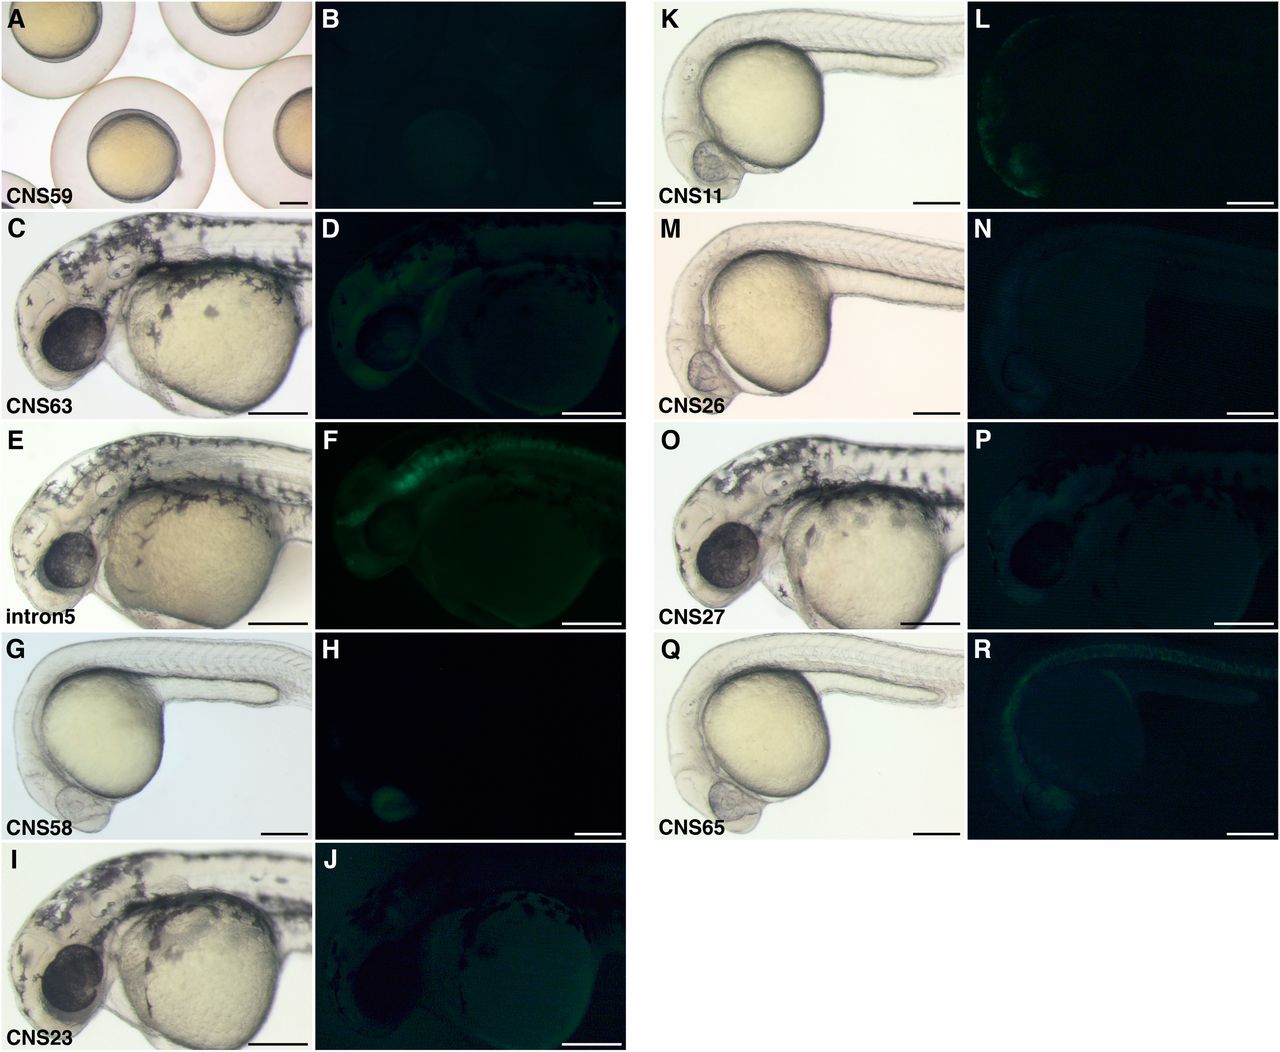
Transgenic zebrafish with DNA fragment around Tbx5 locus. Brightfield (A, C, E, G, I, K, M, O, and Q) and fluorescent (B, D, F, H, J, L, N, P, and R) images. (A and B) CNS59 transgenic zebrafish at 9 hpf. One stable line is screened. (C and D) CNS63 transgenic zebrafish at 36 hpf: one line. (E and F) Tbx5 intron5 transgenic zebrafish at 36 hpf: seven lines. (G and H) CNS58 transgenic zebrafish at 24 hpf: two lines. (I and J) CNS23 transgenic zebrafish at 36 hpf: six lines. (K and L) CNS11 transgenic zebrafish at 24 hpf: one line. (M and N) CNS26 transgenic zebrafish at 36 hpf: one line. (O and P) CNS27 transgenic zebrafish at 36 hpf: one line. (Q and R) CNS65 transgenic zebrafish at 24 hpf: two lines. (Scale bars: 200 µm.)