
Image
|
Figure Caption
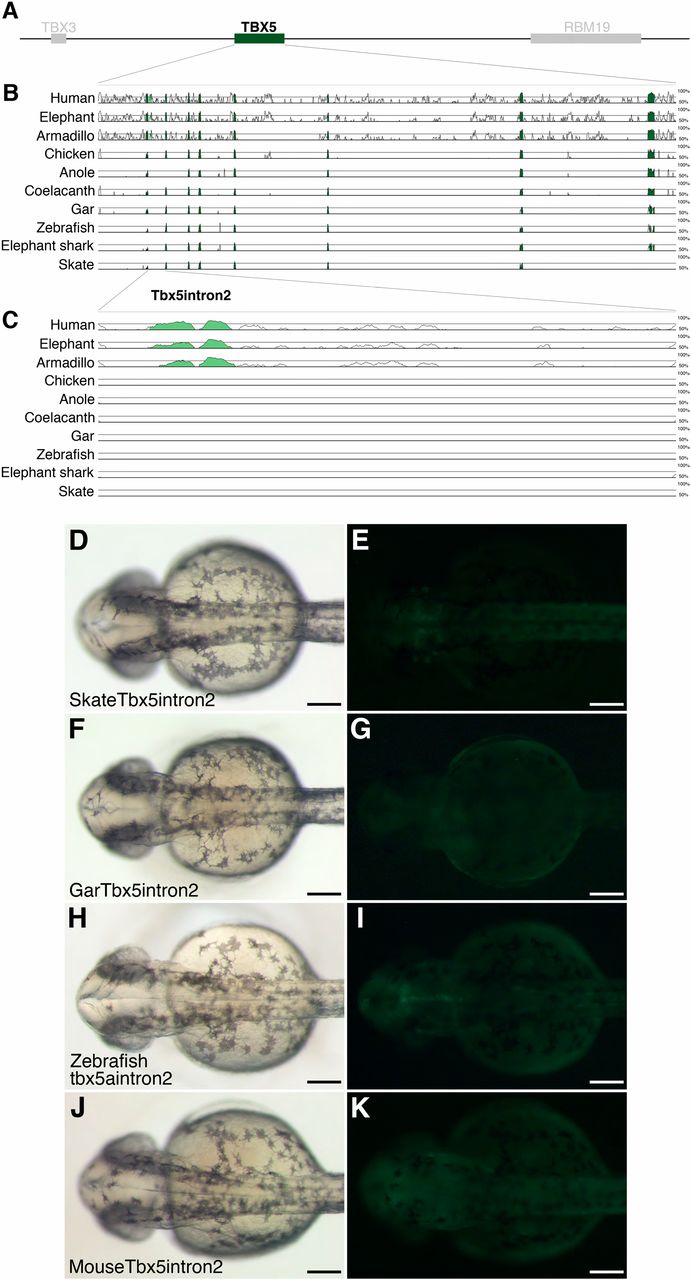
Fig. S4
Sequence alignment of Tbx5 coding region and Tbx5 intron2 transgenic zebrafish. (A) A schematic representation of human TBX5 locus. (B) mVISTA analysis around Tbx5 using the mouse sequence as base. (C) Enlargement of Tbx5 intron2. Conserved sequences are indicated as peaks. Brightfield (D, F, H, and J) and fluorescent (E, G, I, and K) images of Tbx5 intron2 transgenic zebrafish. All images are from dorsal view at 36 hpf. Skate (D and E), gar (F and G), zebrafish (H and I) and mouse (J and K) Tbx5 intron2 never drive GFP signal in the pectoral fin bud. (Scale bars: 200 µm.)
Acknowledgments
This image is the copyrighted work of the attributed author or publisher, and
ZFIN has permission only to display this image to its users.
Additional permissions should be obtained from the applicable author or publisher of the image.
Full text @ Proc. Natl. Acad. Sci. USA