
|
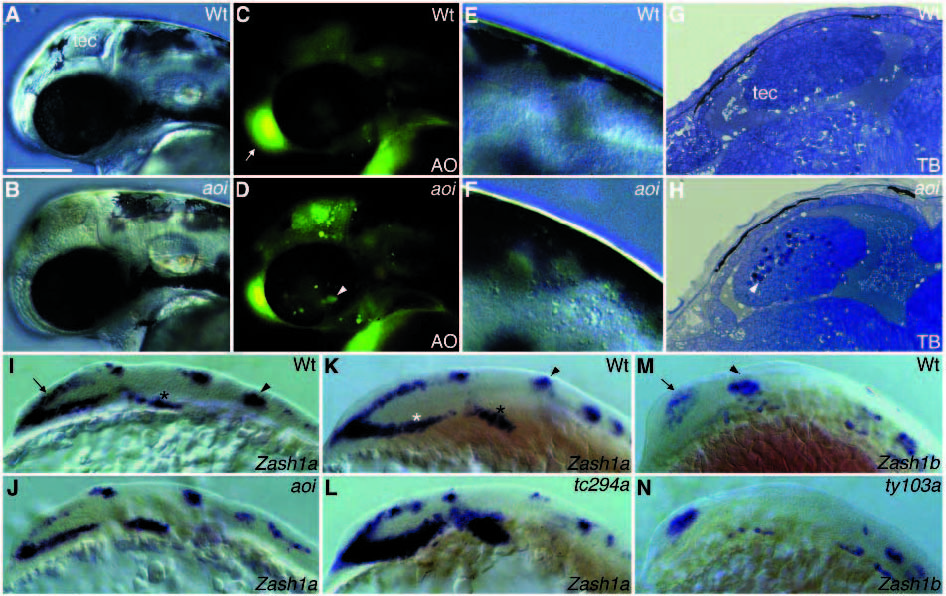
Fig. 2
Class I mutant phenotypes. (A,C,E,G,I,K,M) Wild type; (B,D,F,H,J) aoi, (L) tc294a and (N) ty103a. (A-H) at 36 h; (I-L) at the 10- somite stage and (M,N) at the 15-somite stage. (C,D) Acridine orange (AO)-stained embryos of (A,B) respectively. (G,H) Parasagittal section of the tectum stained with toluidine blue. In situ hybridization with Zash 1a probe (I-L) and with Zash 1b probe (M,N). Apoptotic cells are indicated by white arrowheads. In aoi mutants apoptotic cells are present in the tectum (D,H arrowhead), cerebellar fold, dorsal hindbrain (F) and the neural retina (D arrowhead). Normal olfactory epithelium is stained with acridine orange (C, arrow). (I,J) The dorsal forebrain expression (arrow) and rhombomere 2 expression of Zash 1a (arrowhead) are reduced in aoi mutants whereas ventral midbrain expression (black star) is increased; (K,L) the ventral forebrain expression (white star), tegmentum expression (black star) are increased whereas the midbrain-hindbrain boundary expression of Zash 1a (arrowhead) is reduced in tc294a embryos; (M,N) the telencephalic expression of Zash 1b (arrow) is increased in contrast to the absence of its midbrain expression (arrowhead) in ty103a. Scale bar, approximately 100 µm in A-D and IN; 200 µm in E and F; 300 µm in G and H.