
|
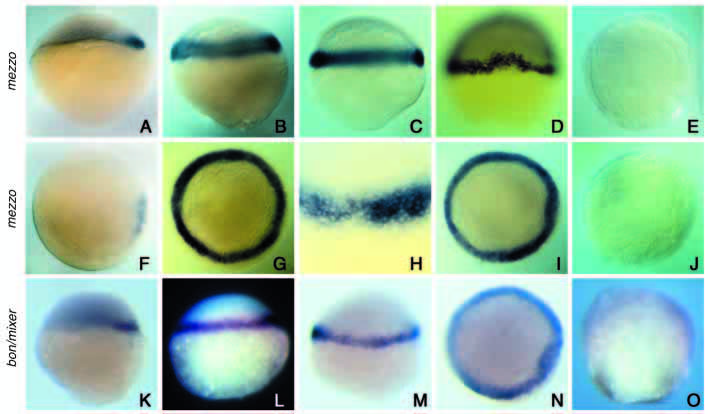
Fig. 2
Analysis of mezzo expression in wildtype embryos and comparison with bon/mixer. (A,F,K) Sphere stage (4 hpf), (B,G,L) 30% epiboly (4.7 hpf), (C,H,M) 50% epiboly (5.3 hpf), (D,I,N) shield stage (6 hours), (E,J,O) 70% epiboly (8 hpf). (A-E,K-M,O) Side views. (G,I,J,N) Views from the animal pole. (F,D) Dorsal views. mezzo (A,F) and bon/mixer (K) start to be expressed in a small group of cells on the dorsal side at the sphere stage. At 30% epiboly, expression of mezzo (B,G) and mixer (L) has extended over the whole marginal region. A close examination of mezzo expression at 50% epiboly (H) shows that mezzo transcripts are present in about six rows of cells at the margin of the blastoderm. No expression is detected in the YSL (C,H,M). At the shield stage, mezzo and mixer continue to be expressed throughout the marginal region and in the dorsal shield (D,I,N). At 70% epiboly, mezzo and mixer have been turned off and transcripts are no longer detected in the embryo (E,J,O).