
Image
|
Figure Caption
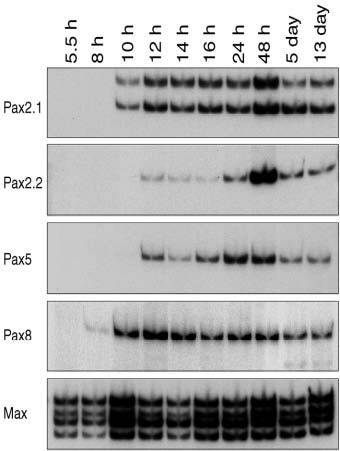
Fig. 2
Temporal expression of the Pax2/5/8 genes during zebrafish embryogenesis. Total RNA of the indicated developmental stages was analyzed by quantitative RT-PCR using gene-specific primers. All cDNA sequences were amplified across the exon 5-exon 6 junction. The two PCR products of the Pax2.1 mRNA differ by the presence (upper band) or absence (lower band) of exon 5.1. The ubiquitiously expressed mRNA of the max gene (Kelly et al., 1995) was analyzed to quantitate the reverse-transcribed cDNA input of the PCR reaction.
Figure Data
Acknowledgments
This image is the copyrighted work of the attributed author or publisher, and
ZFIN has permission only to display this image to its users.
Additional permissions should be obtained from the applicable author or publisher of the image.
Full text @ Development