
IMAGE
Fig. 2
- ID
- ZDB-IMAGE-160913-28
- Genes
- Antibodies
- Publication
- Batut et al., 2015 - Expression patterns of CREB binding protein (CREBBP) and its methylated species during zebrafish development
- All Figures
- Figures for Batut et al., 2015
Image
|
Figure Caption
Fig. 2
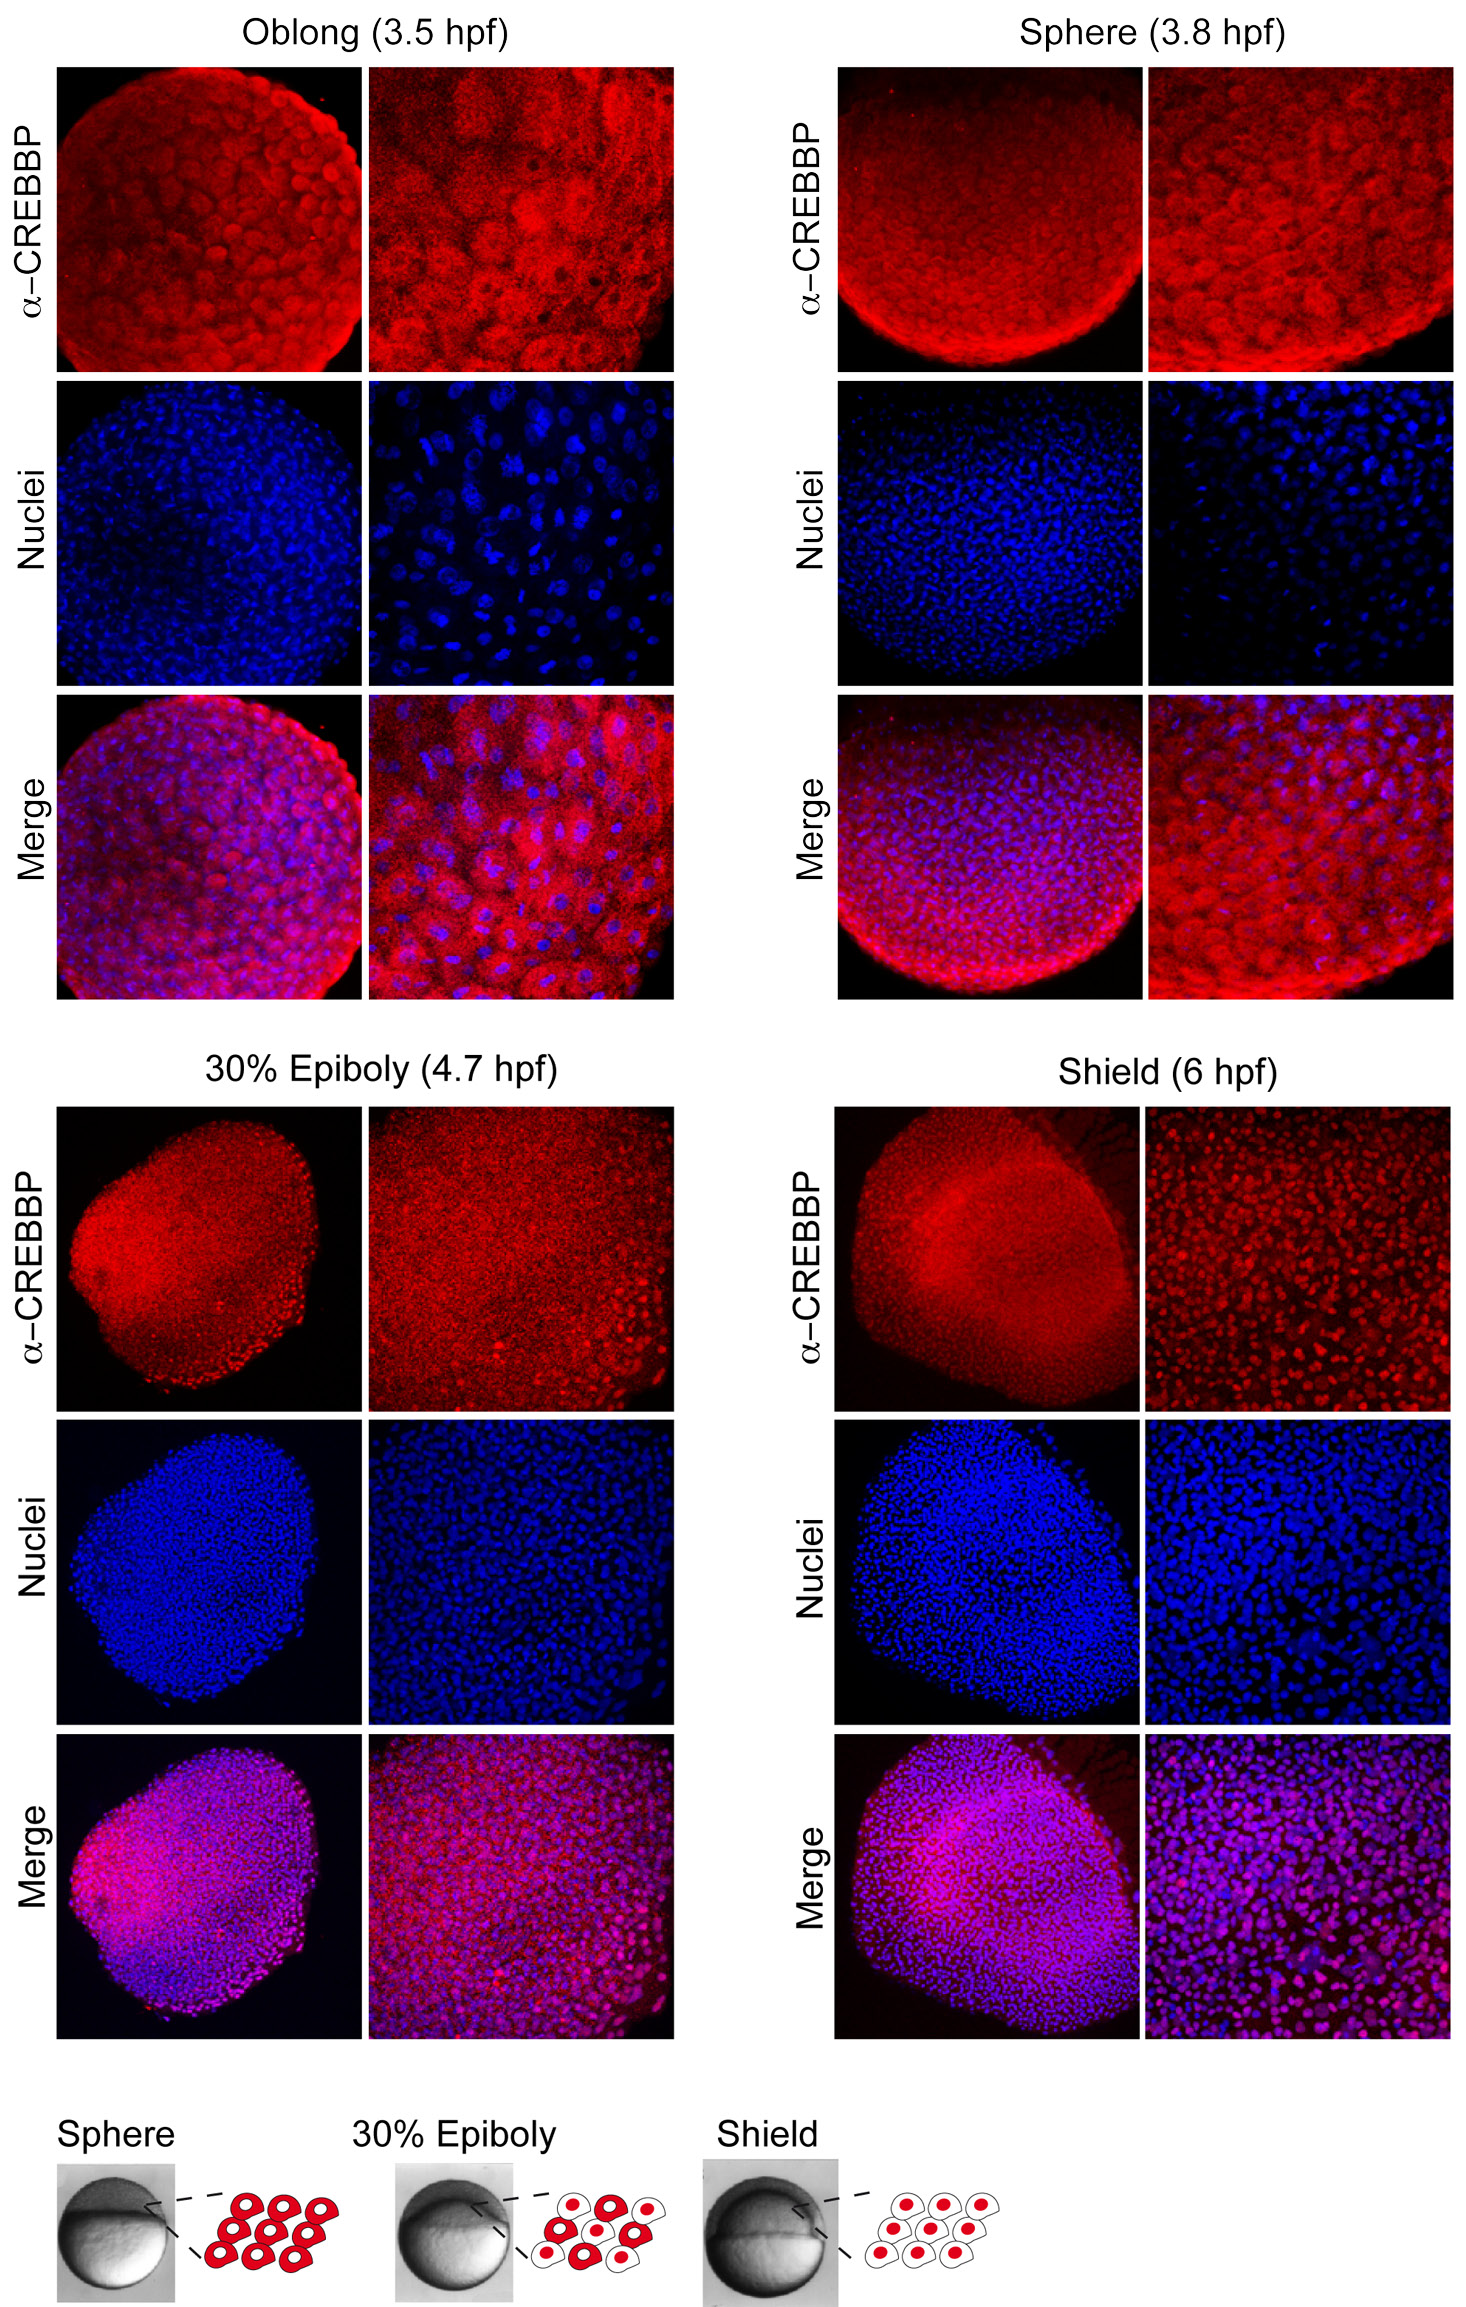
CREBBP protein expression patterns from blastula to gastrula. (A-D) Immunohistochemistry with CREBBP specific antibody at (A) oblong, (B) sphere, (C) 30% epiboly and (D) shield stages. Nuclei are visualized in blue with TO-PRO3 staining and a merged picture is shown. (E) Schematic illustration of CREBBP subcellular localization at these stages, cells are shown with CREBBP labeled in red.
Figure Data
Acknowledgments
This image is the copyrighted work of the attributed author or publisher, and
ZFIN has permission only to display this image to its users.
Additional permissions should be obtained from the applicable author or publisher of the image.
Full text @ Int. J. Dev. Biol.