
|
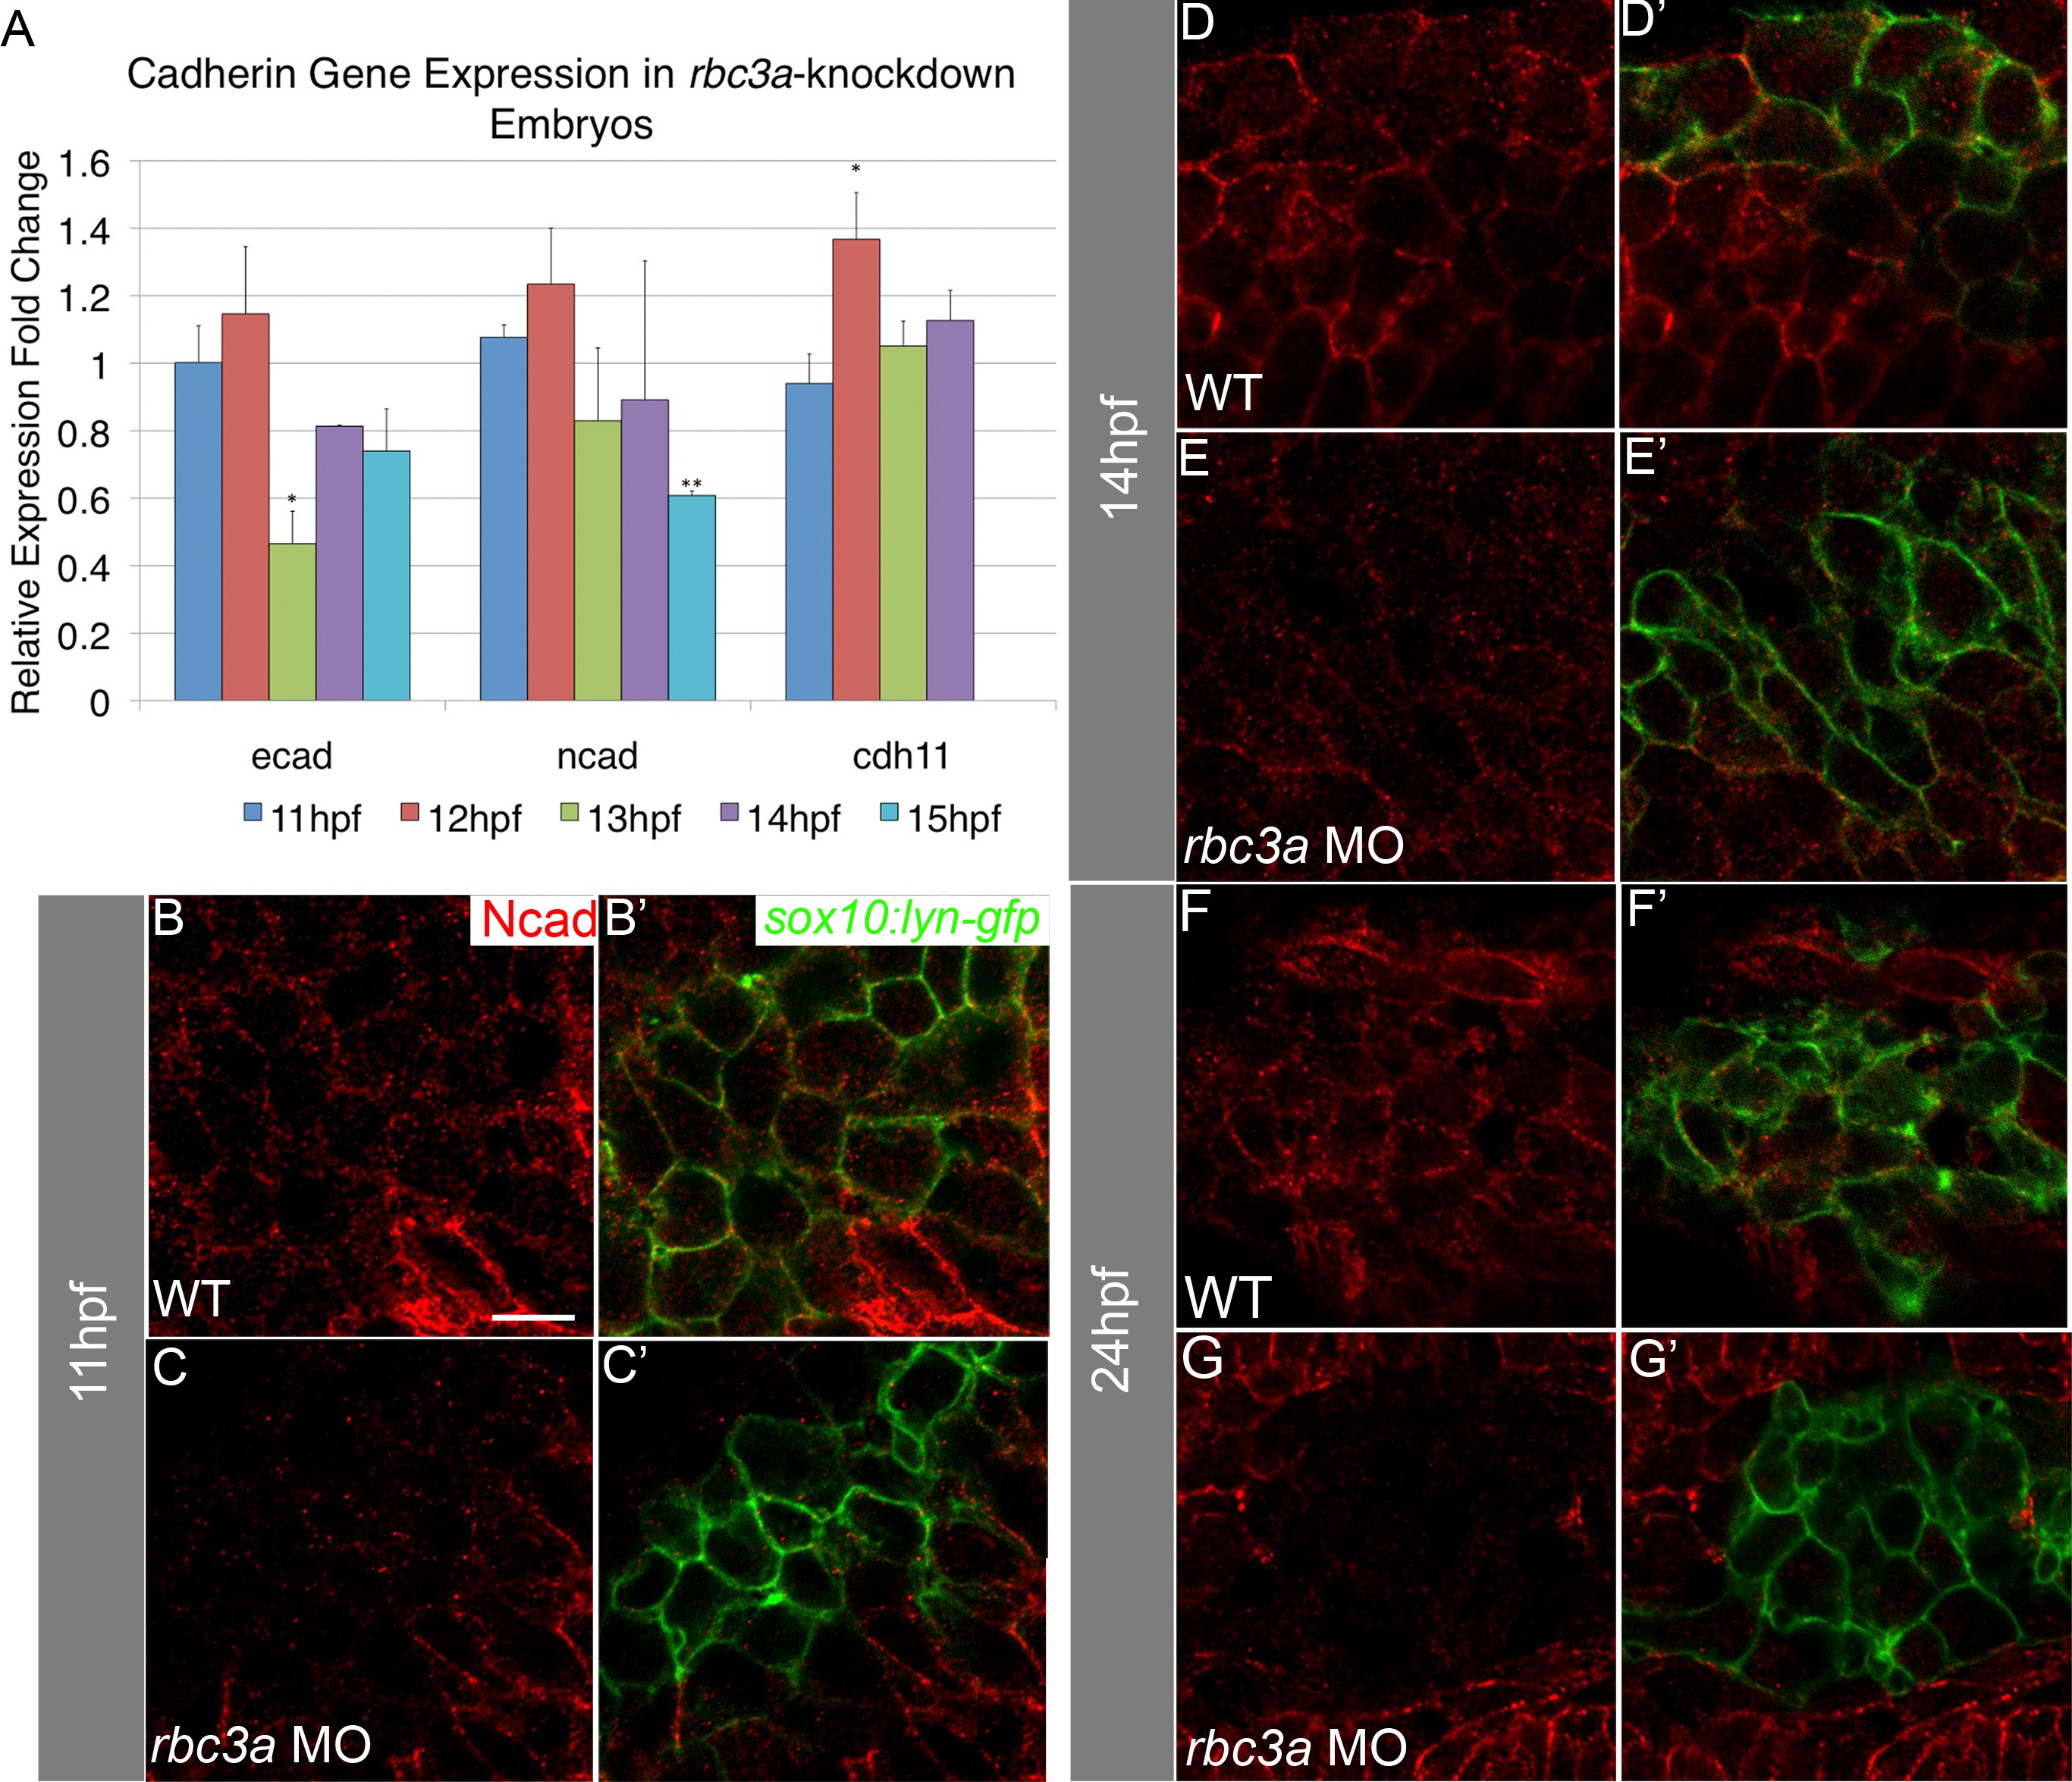
Fig. 6
Rbc3a knockdown reduces expression of cadherins in NC cells.
(A) Quantitative real-time PCR for ecad, ncad, and cdh11 at four timepoints during the onset of NC migration in rbc3a-MO1-injected embryos. ecad expression is significantly down-regulated at 13 hpf and remains low. ncad expression is also significantly reduced by 15 hpf. In contrast, cdh11 expression increases at 12 hpf. Error bars represent triplicate experiments ± SEM. (B-G′) Confocal images of immunohistochemical staining for Ncad (red) in sox10:lyn-gfp transgenics (green) at 11 hpf (B-C′), 14 hpf (D-E′), and 24 hpf (F-G′). Ncad levels are reduced at the membranes of GFP+ cells by 14 hpf in rbc3a-MO1-injected embryos and almost completely absent in the NC of rbc3a-MO1-injected embryos by 24 hpf, while still present at the membrane in surrounding cells. * p<0.05, ** p<0.01. Scale bar, 10 µm.