
Fig. 8
- ID
- ZDB-IMAGE-160803-6
- Genes
- Publication
- Lai et al., 2014 - Zebrafish WNK Lysine Deficient Protein Kinase 1 (wnk1) Affects Angiogenesis Associated with VEGF Signaling
- All Figures
- Figures for Lai et al., 2014
|
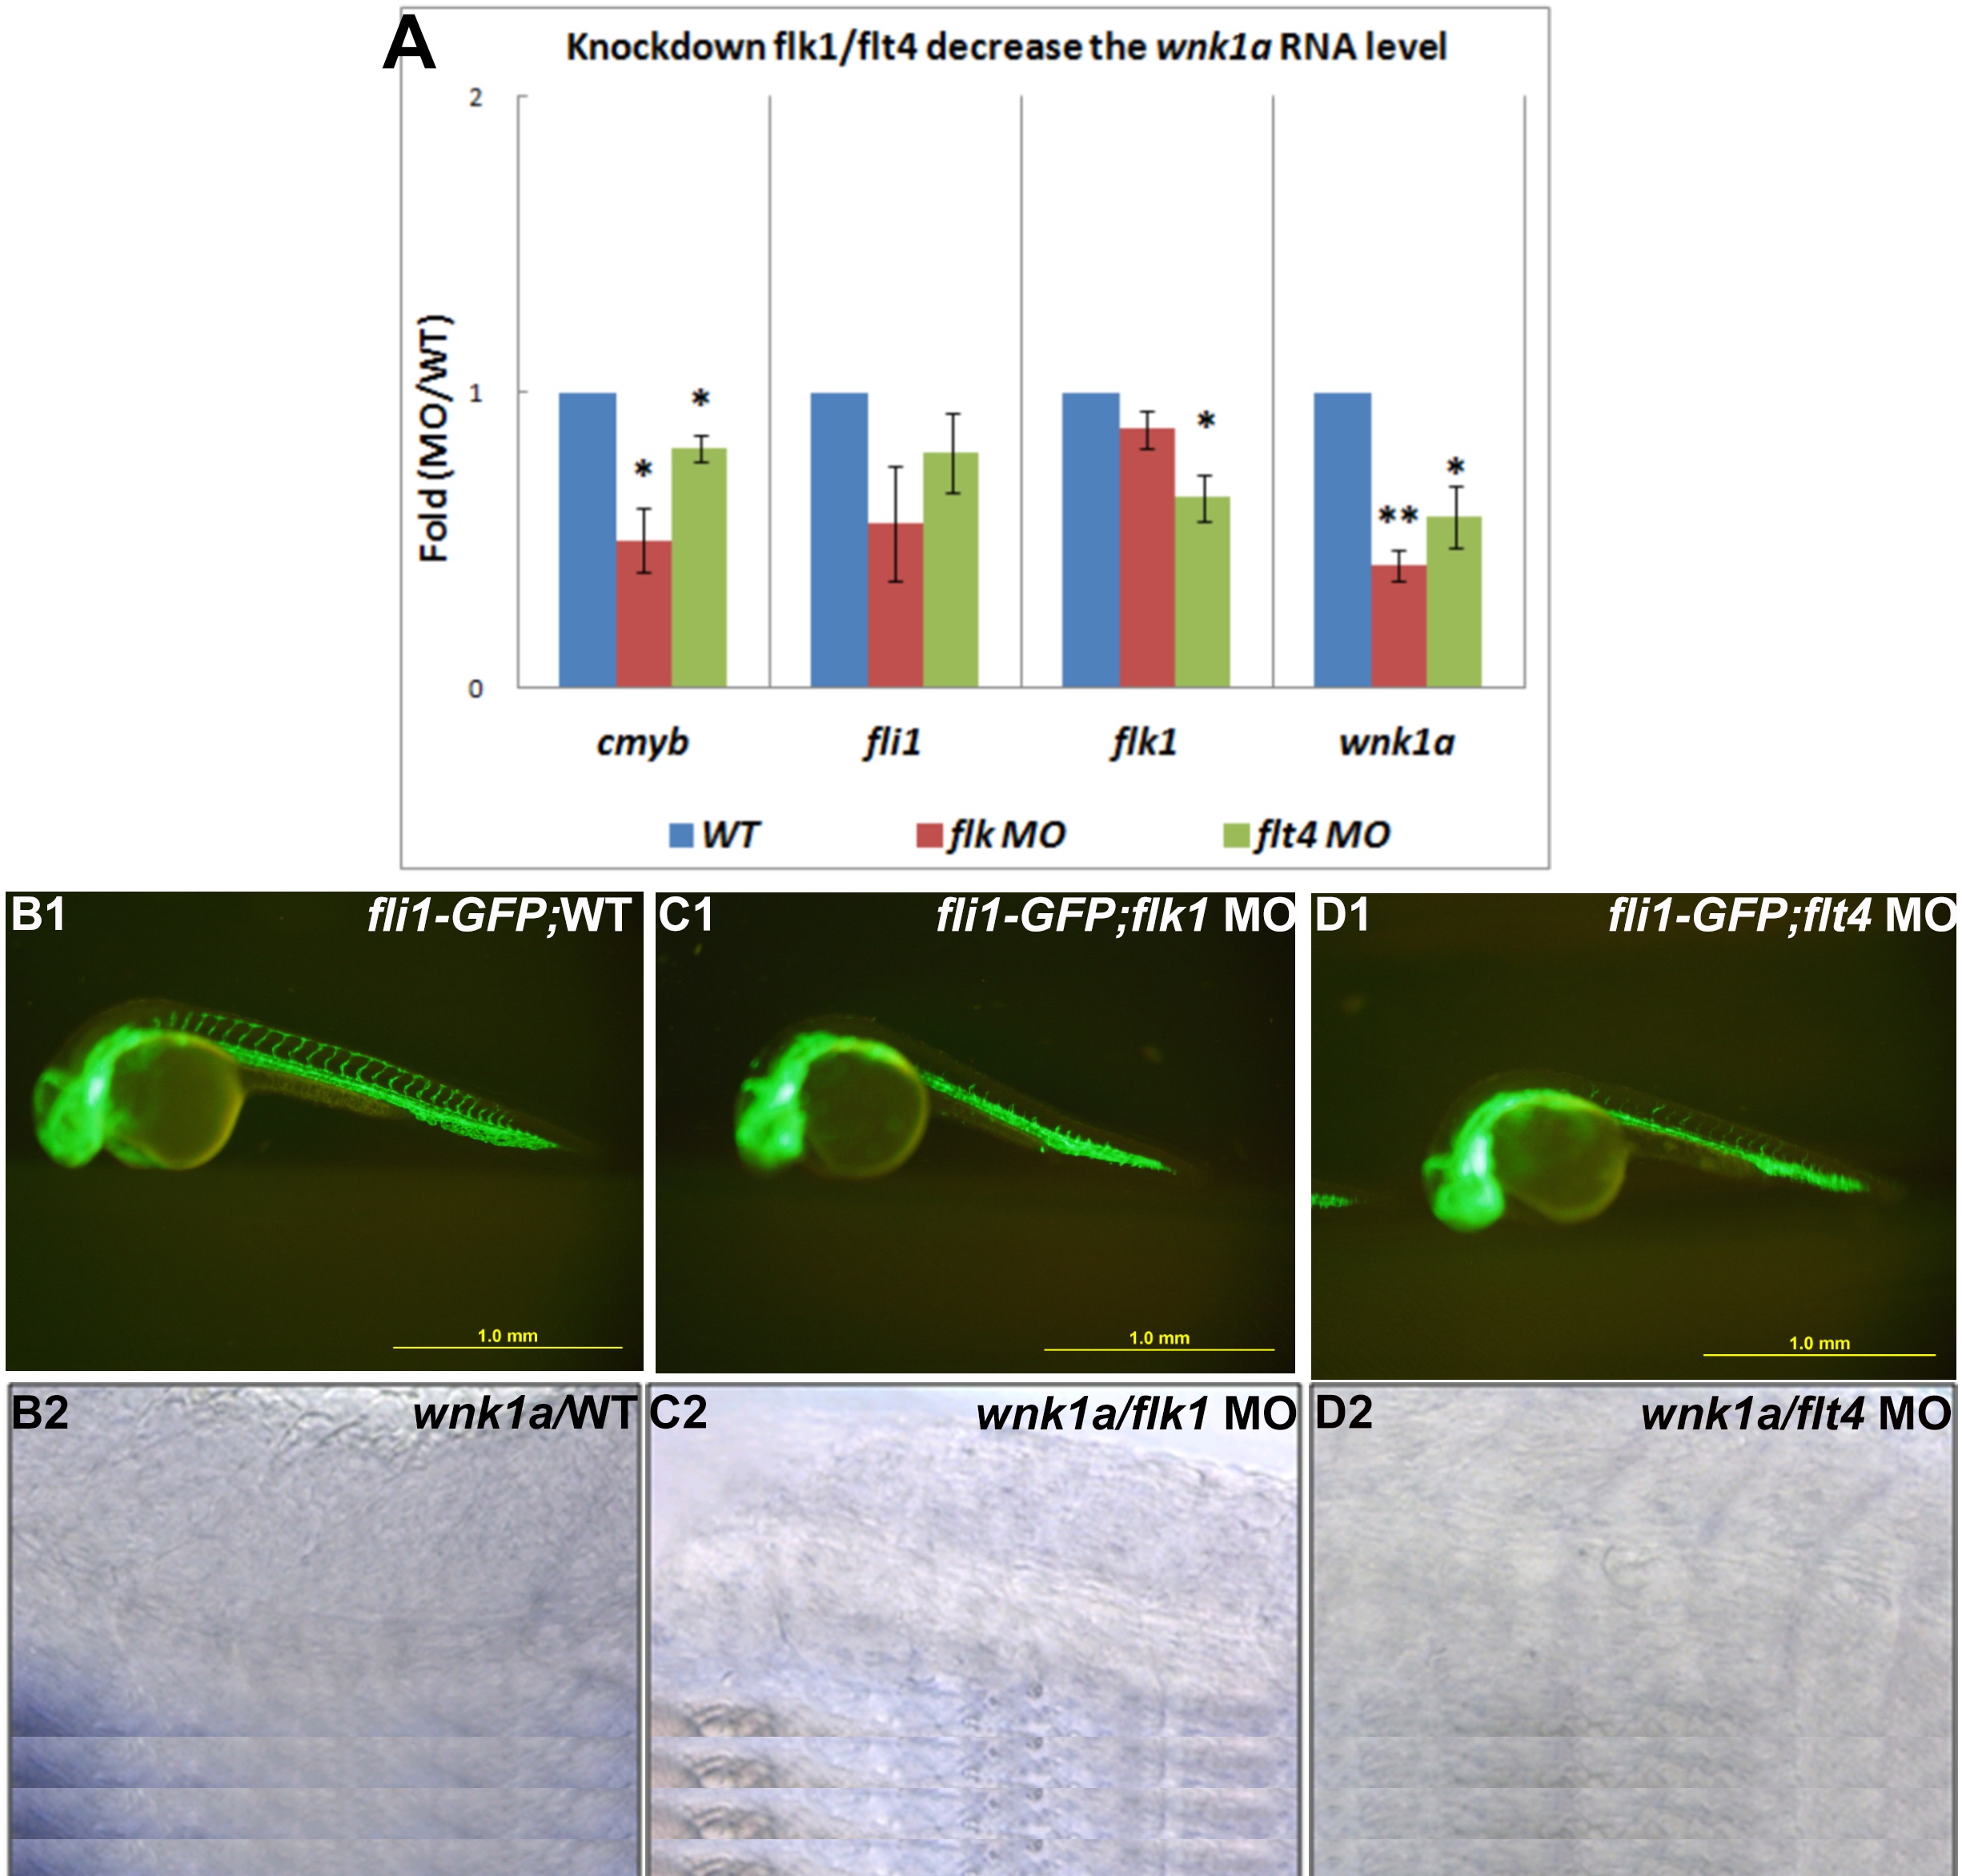
Fig. 8
Injections of flk1 MO and flt4 MO decrease wnk1 mRNA expression.
(A) Relative fold-change comparisons between flk1 and flt4 morphants and uninjected controls. Comparison of mRNA expression levels at 33 hpf for important transcription factors, receptors, and wnk1. Blue, red, and green bars denote mRNA expression in wild-type embryos, flk1 morphants and flt4 morphants, respectively. The x-axis indicates the expressed genes, and the y-axis shows the fold differences between the morphants and the control. The differences between treatments were assessed using a two-tailed Student’s t-test. Significant differences between the morphants and the controls are indicated (*, P<0.05 and**, P<0.01). (B1, C1, D1) The ISVs are affected in morphants compared with wild-type embryos. (B2, C2 and D2) The expression of wnk1a is reduced in the PCV in flk1 and flt4 morphants. wnk1a mRNA was detected with in situ hybridization in wild-type embryos (B2), flk1 morphants (C2) and flt4 morphants (D2).