
|
Fig. 2
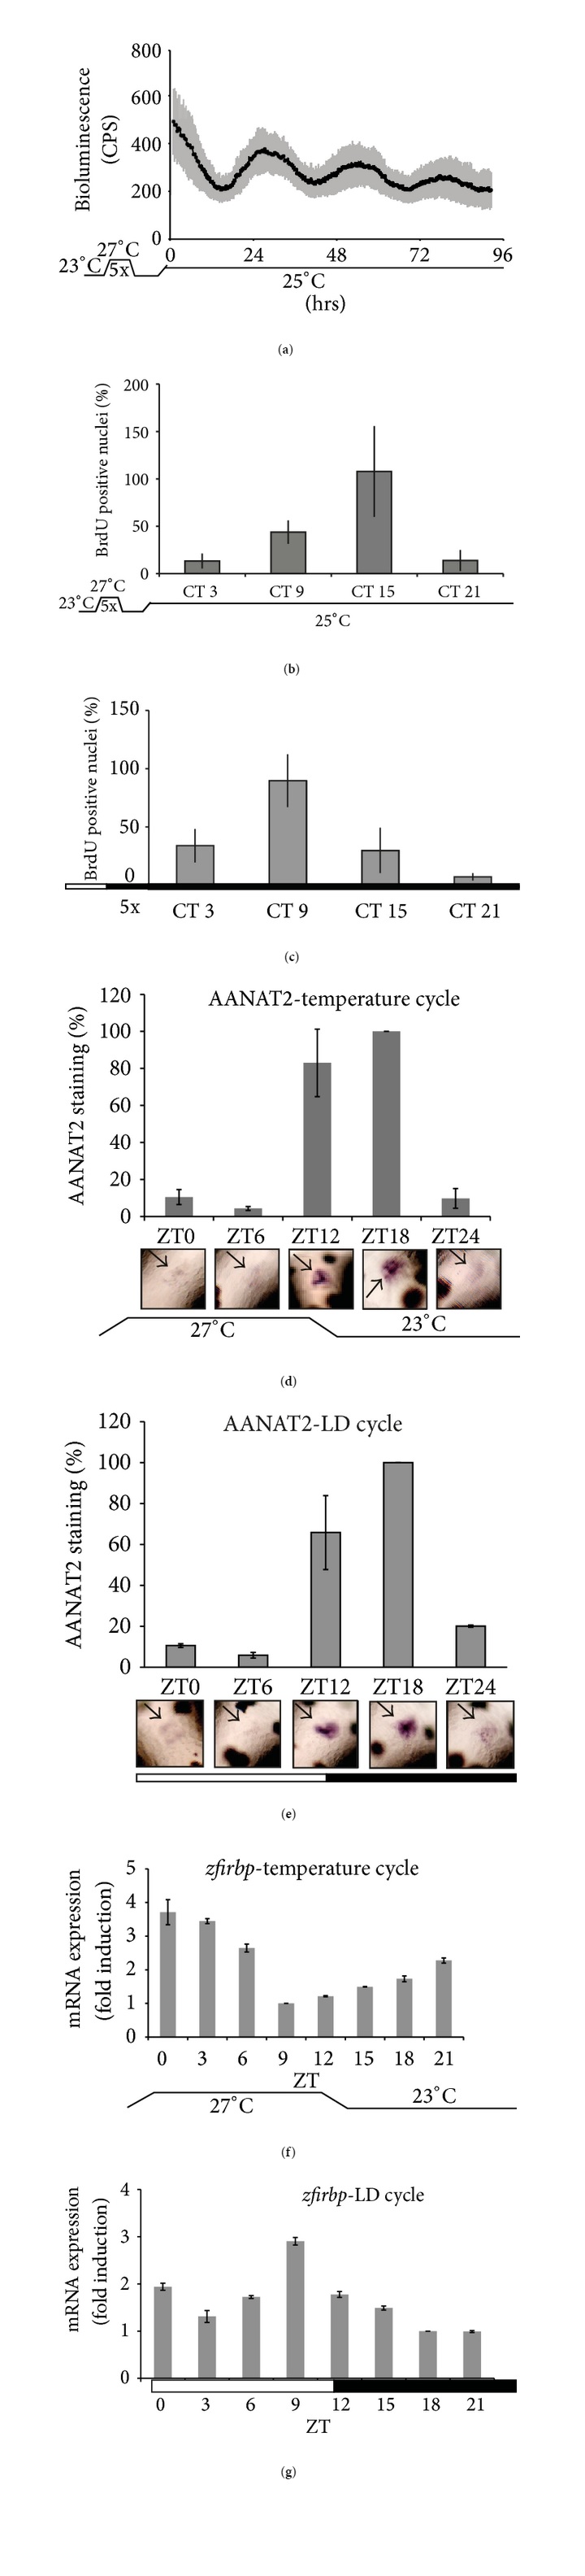
Clock entrainment by temperature cycles in developing zebrafish embryos. (a) Mean values of bioluminescence expression profiles from transgenic larvae entrained for 5 days under 4°C temperature cycles (23–27°C) in constant darkness and then monitored at a constant temperature of 25°C. ((b)-(c)) Whole-mount staining for BrdU incorporation in skin cells of larvae previously entrained by 5× temperature (b) and 5× LD (c) cycles and then sampled during the first day after transfer to constant conditions (darkness and 25°C). The number of BrdU positive nuclei (S-phase nuclei), normalized as percentage (%) of the highest experimental value, is plotted on the y-axis. ((d)-(e)) Rhythmic expression of the circadian clock-regulated zfaanat2 gene in 5 dpf zebrafish larvae under 4°C temperature (d) or light/dark (e) cycles. In each panel, representative zfaanat2 in situ hybridization images and quantification graphs from independent experiments (each time point included a minimum of 20 larvae) are shown. On the y-axis, expression levels are expressed as % of the highest level measured in each set. Black arrows indicate the position of the zfaanat2 mRNA signal in the pineal gland. ((f)-(g)) Quantification of the RNAse protection analysis of zfirbp expression in whole larva mRNA extracts in larvae entrained under 5× temperature (f) or 5× LD (g) cycles. In each panel, the x-axes indicate the times of measurement (hrs), the circadian (CT), or the zeitgeber (ZT) times. On the y-axis, expression levels are expressed as fold induction compared to the lowest level measured in the set. In each panel, points are plotted as the means of three independent experiments ± SEM. The black horizontal lines beneath panels (a) and (b) indicate constant temperature while the temperature cycles in panels (a), (b), (d), and (f) are indicated. Black and white bars beneath panels (c), (e), and (g) indicate the dark and light periods of the lighting regimes, respectively.