
Image
|
Figure Caption
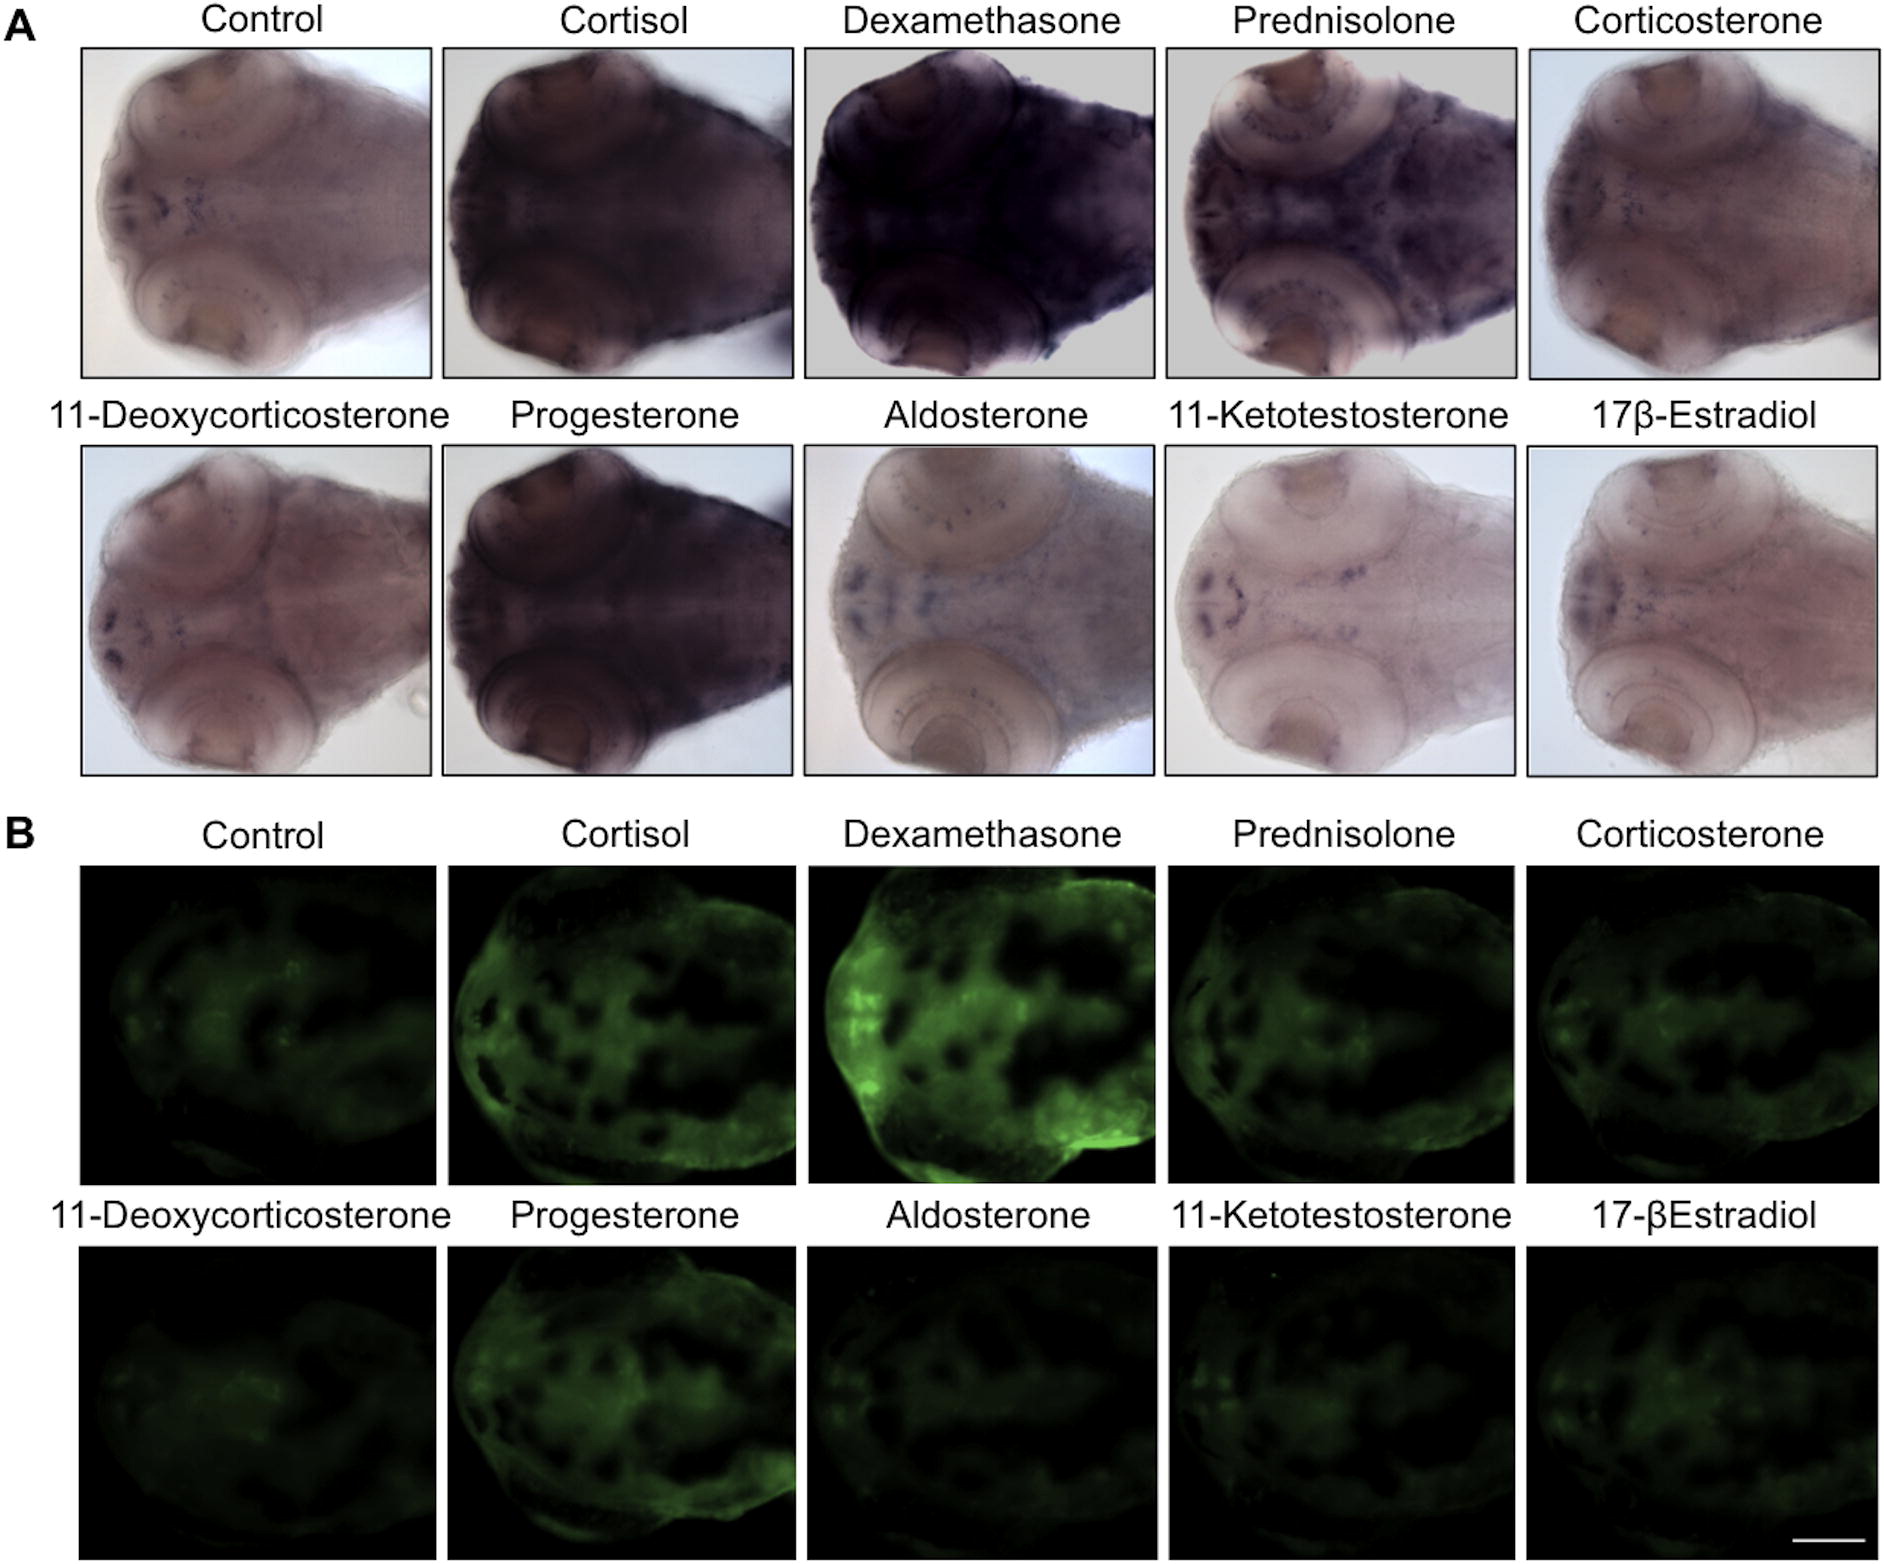
Fig. 4
Transgenic line responses to different steroid treatments. (A) Light microscopy dorsal view and (B) fluorescence microscopy images of 3-dpf transgenic zebrafish treated for 48 h with the indicated compounds. In (A) responses were visualized by WMISH of egfp mRNA. Cortisol, dexamethasone, prednisolone, progesterone and corticosterone treatments increased reporter activity compared to control, while no changes were detectable with 11β-deoxycorticosterone (DOC), aldosterone, 11-ketotestosterone and 17β-estradiol (E2). Scale bar: 200 µM.
Figure Data
Acknowledgments
This image is the copyrighted work of the attributed author or publisher, and
ZFIN has permission only to display this image to its users.
Additional permissions should be obtained from the applicable author or publisher of the image.
Reprinted from Molecular and Cellular Endocrinology, 392(1-2), Benato, F., Colletti, E., Skobo, T., Moro, E., Colombo, L., Argenton, F., Dalla Valle, L., A living biosensor model to dynamically trace glucocorticoid transcriptional activity during development and adult life in zebrafish, 60-72, Copyright (2014) with permission from Elsevier. Full text @ Mol. Cell. Endocrinol.