
|
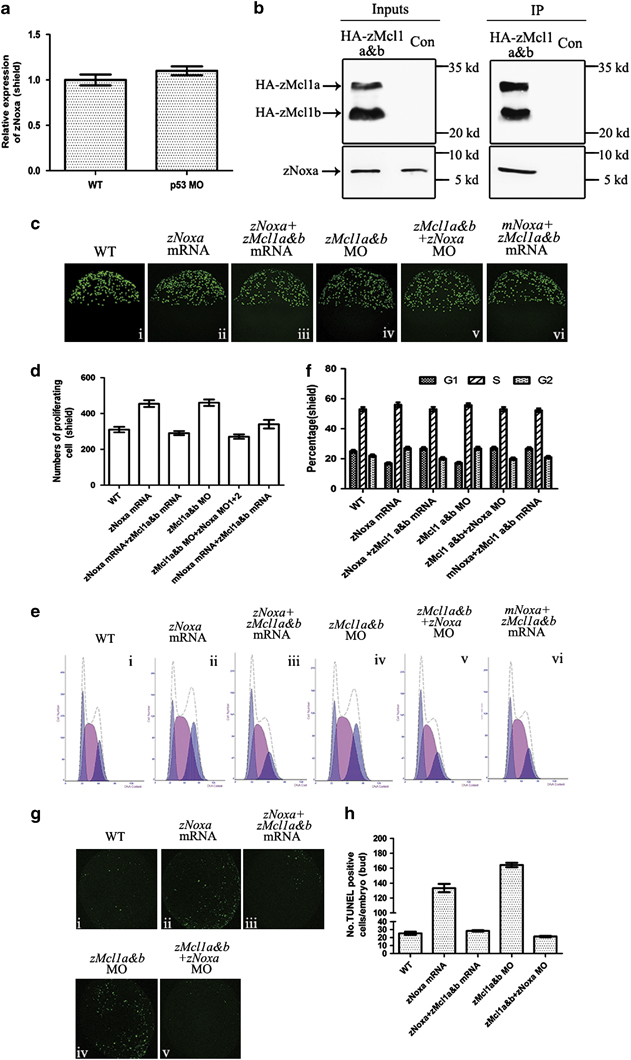
Fig. 4
The ability of zNoxa is suppressed by zMcl1a and zMcl1b. (a) Expression of zNoxa in WT and p53 MO-injected embryos was evaluated by real-time PCR and normalized to β-actin mRNA. (b) pcDNA3.1-HA-zMcl1a and pcDNA3.1-HA-zMcl1b were injected into zebrafish embryos to assess an interaction with endogenous zNoxa. At shield stage, zMcl1a-HA and zMcl1b-HA were immunoprecipitated (IP) and then the co-precipitation of zNoxa was assessed by immunobloting. (c) Confocal z-stacks of mitotic cells assessed by pH3 staining in embryos which were WT (i) and injected with zNoxa mRNA (ii), combined zNoxa mRNA and zMcl1a&b mRNA (iii), zMcl1a&b MOs (iv), zNoxa MO1+2 plus zMcl1a&b MOs (v) or mNoxa mRNA together with zMcl1a&b mRNA (vi) at shield stage. Embryos stained by pH3 were lateral views with animal pole toward the top and dorsal to the right. (d) Quantification of numbers of pH3-positive cells with five embryos for each group in (c). Error bars represent S.E.M. (n=5). (e) A typical FACS analysis of PI-labeled cells in embryos for each group in c. (f) The FACS statistical data of three independent experiments in e. Error bars represent S.E.M. (n=3). (g) Confocal z-stacks of apoptotic cells assessed by TUNEL in embryos which were WT (i), injected with zNoxa mRNA (ii), combined zNoxa mRNA and zMcl1a&b mRNA (iii), zMcl1a&b MO (iv), zNoxa MO1+2 together with zMcl1a&b MO (v) at bud stage. Embryos were lateral views with animal pole toward the top and dorsal to the right. (h) Quantification of numbers of TUNEL-positive cells with four embryos for each group in g. Error bars represent S.E.M. (n=4)