
|
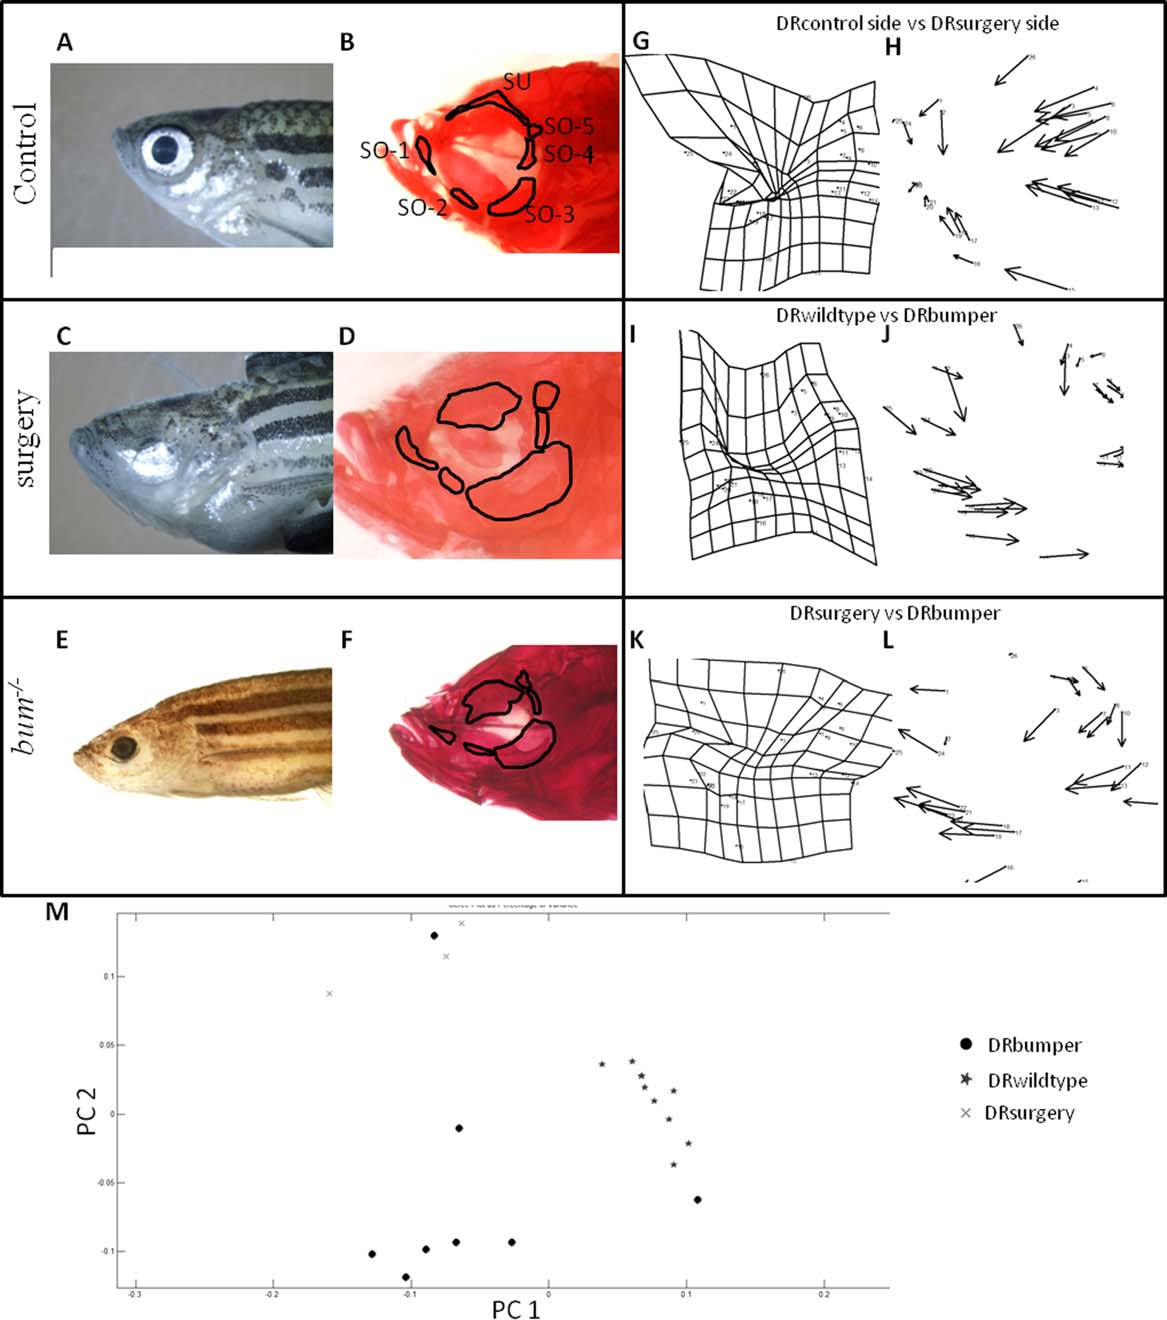
Fig. 5
Whole-mount bone stained specimens showing craniofacial bones, thin plate splines, and vector analyses of surgery zebrafish, control zebrafish, control side, and the bumper mutant. A, C, E are unstained; B, D, F, are stained with alizarin red. A,B: Control zebrafish. C,D: lens ablated zebrafish. E,F: bum-/- zebrafish mutant. All scale bars = 500 µm. G-L: Thin plate spline and vector analysis of comparison between the surgery, control, and bumper mutant zebrafish. Anterior is to the left; posterior is to the right. G,I,K: Deformation grids. H,J,K: Vector analyzes. G,H: Comparison of surgery zebrafish and control side of the head. I,J: Comparison between wild-type and the bumper mutant. In H, the origin of the vectors is the control side of the head and the arrow head is the location of surgery side of the head; in I the origin of the vectors is the control side of the head and the arrow head is the location of the bumper datapoint. K,L: Thin plate spline and vector analysis of comparison between the surgery zebrafish and the bumper mutant. M: Principle component analysis comparing bum-/- mutants, surgery zebrafish and control zebrafish.