
|
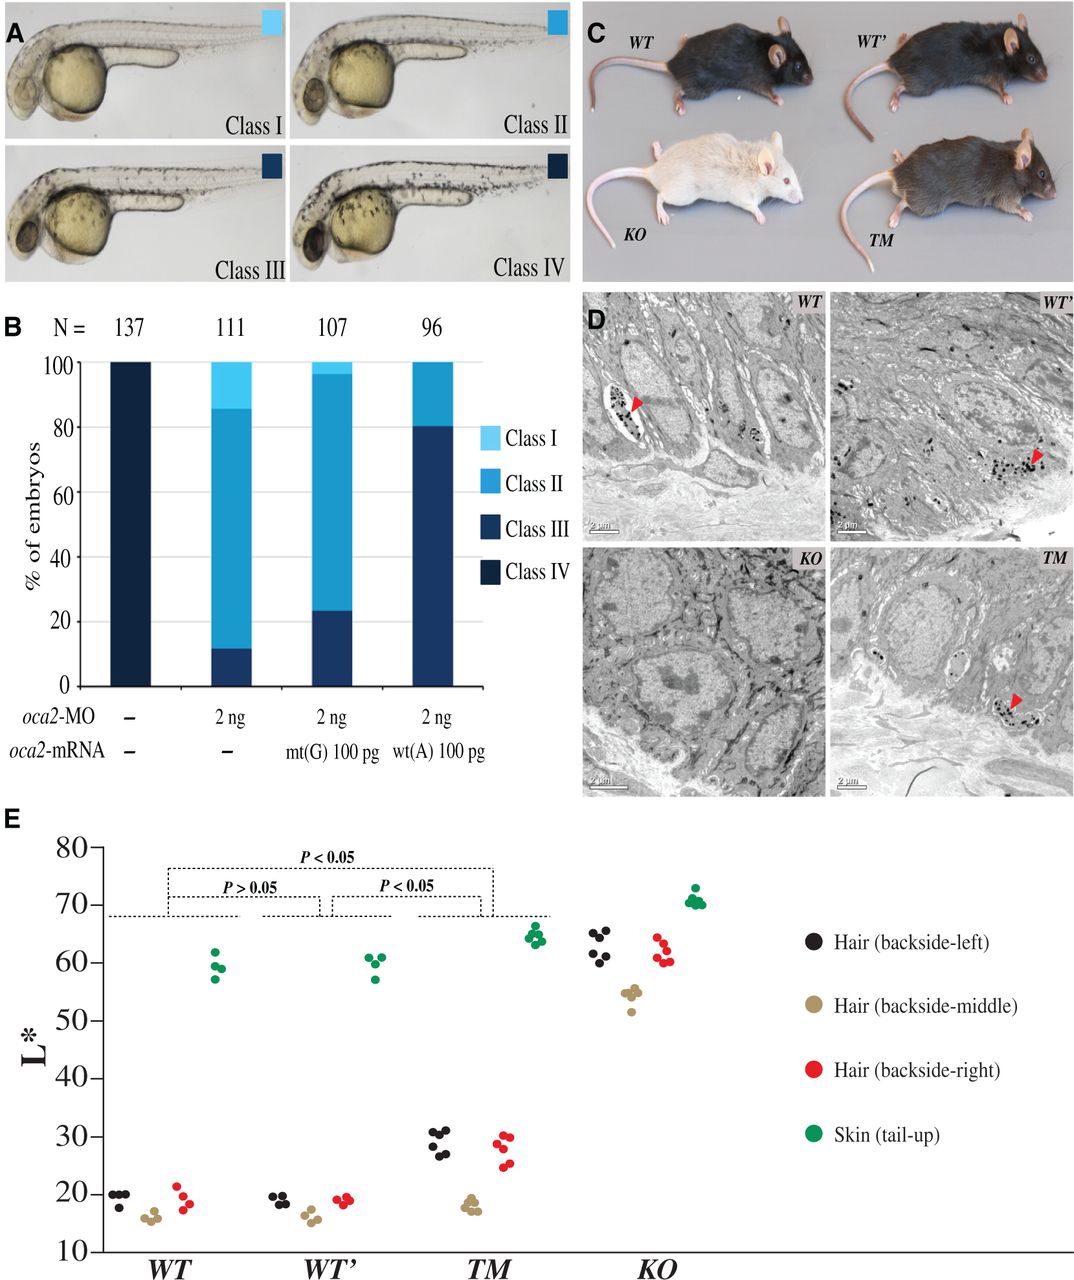
Fig. 4
Transgenic and targeted gene modification analyses of zebrafishes and mice. (A and B) Effect of oca2 wt(A) or mt(G) mRNA overexpression in oca2 morphants. (A) The embryos at 36 h postfertilization were classified into four classes based on melanophore pigmentation. Class IV, wild-type pigmentation; Class I–III, different levels of pigmentation reduction. (B) Ratios of different classes of embryos. N, the total number of observed embryos. Note that, unlike wt(A) mRNA, mt(G) mRNA coinjection could not efficiently restore pigmentation in oca2-MO injected embryos. (C) Coloration comparison among different mouse strains, including the wild-type strain (WT), the strain containing two synonymous mutations (WT′), the knockout strain (KO), and the targeted modification strain (TM). (D) The distribution of melanosomes in the tail skin of different mouse strains. The “arrow” indicates the melanosomes in sectioned skin. (E) Quantification of hair and skin pigmentation among the mouse strains (WT, WT′, TM, and KO). The y axis indicates the L* value of the four measured body parts with the error bars indicating standard deviations. The P values are shown in the plot (Wilcoxon rank sum test). More details are presented in supplementary tables S6 and S7, Supplementary Material online.