
Fig. 5
- ID
- ZDB-IMAGE-160519-25
- Publication
- Welte et al., 2015 - Upregulation of the zebrafish Nogo-A homologue, Rtn4b, in retinal ganglion cells is functionally involved in axon regeneration
- All Figures
- Figures for Welte et al., 2015
|
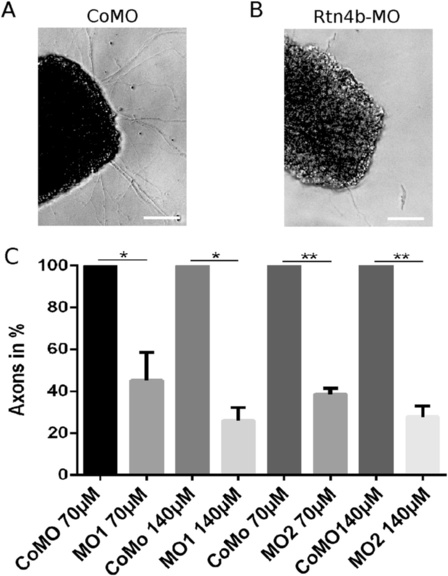
Fig. 5
Quantification of axon number after MO application in the outgrowth assay. (A,B) Retina mini-explants isolated from retinae 5 days after (A) control MO (Co) or (B) Rtn4b MO1 application to the optic nerve, extend axons and axon fascicles (arrows) after 24 h in vitro. Outgrowth is significantly reduced on the Rtn4b MO-treated side. Scale bar, 100 µm. (C) The histogram demonstrates the decline in the number of axons extending from retina explants in vitro after MO1 and MO2 application to the optic nerve, in comparison to axon number from control (Co) MO-treated fish (100%). Bars indicate standard deviation. The differences between groups are statistically significantly different. Quantification was done on three replicates from three different experiments, and for statistical analysis, Student’s T-test was used. *P < 0.05, **P < 0.01.