
|
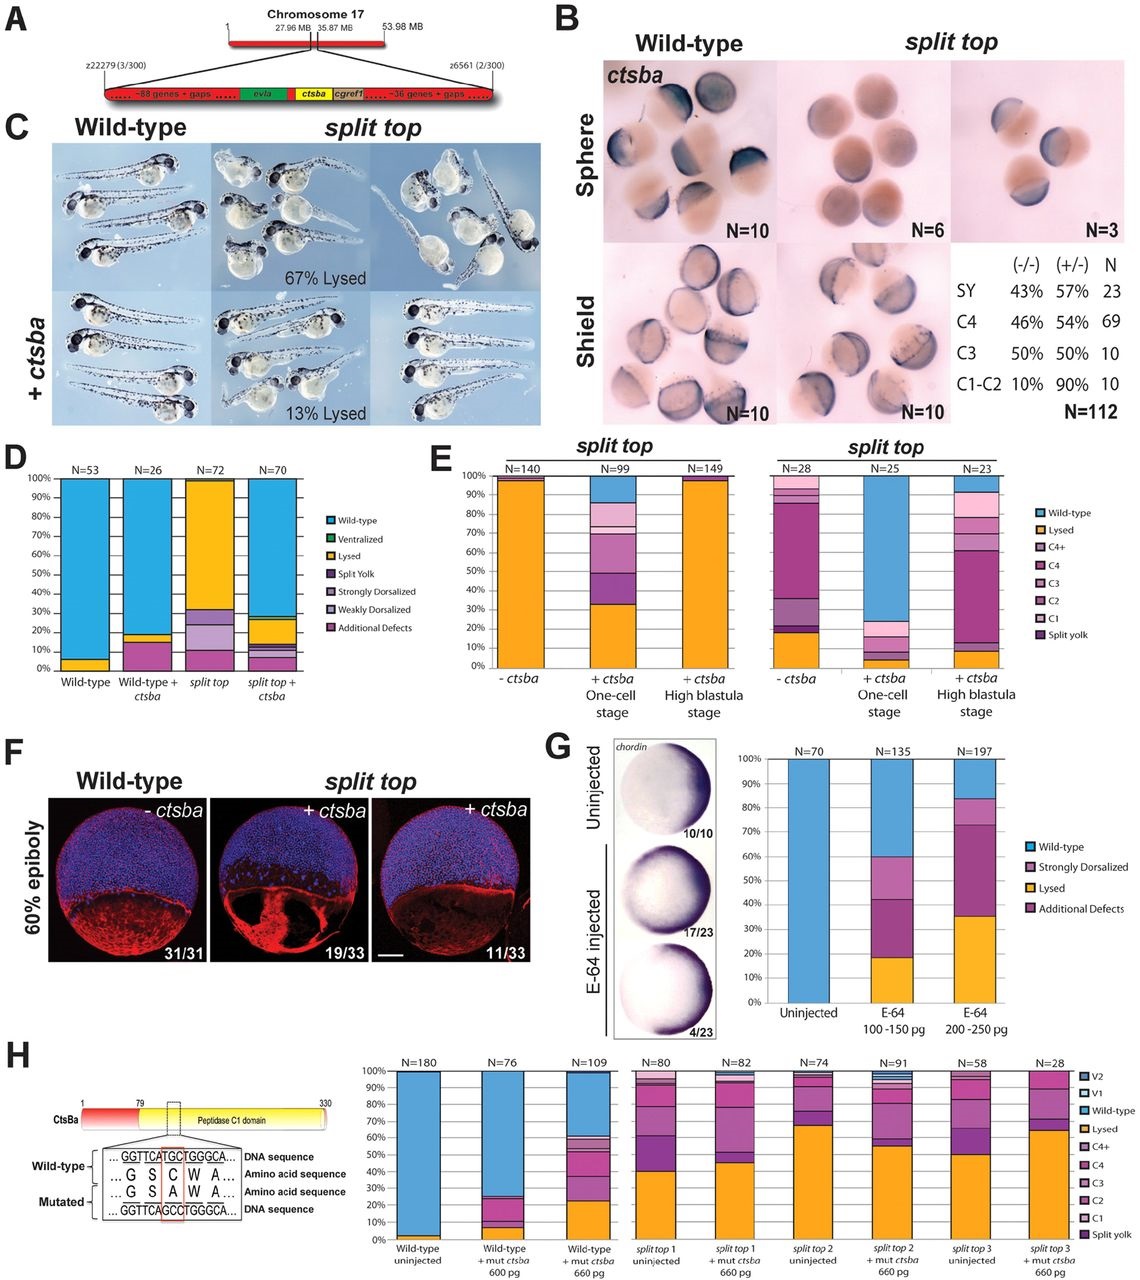
Fig. 7
Cathepsin Ba is deficient in split top mutant embryos. (A) Schematic of the split top interval on chromosome 17. (B) ctsba mRNA expression in wild-type and split top mutant embryos. The genotype and strength of the split top mutant phenotype. (C) Representative phenotypes of uninjected and ctsba-injected wild-type and split top mutant embryos, and (D) bar graphs showing rescue. (E) ctsba mRNA injection in the yolk cell of mid-blastula (high to dome stage) embryos from two homozygous split top mutant females did not rescue the lysis or dorsalized phenotypes. (F) Whole-mount 60% epiboly (early gastrula) embryos stained with actin (red) and DAPI (blue). All uninjected split top mutants exhibited large patches of actin-deficient YCL regions. In the right embryo injected with ctsba mRNA, the gap between the YSN/EVL and the deep cells is rescued, along with partial rescue of the actin cytoskeleton; 3 of 33 embryos showed no actin staining. Scale bar: 140µm. (G) E-64-injected wild-type embryos show expanded chordin expression (animal pole view, dorsal to right). Bar graphs show 1dpf phenotypic distributions. (H) Mis-sense mutation made in the catalytic domain of Ctsba. Bar graphs show 1dpf phenotypic distributions of this mutant mRNA injected into wild-type embryos or embryos from three different split top mutant females.