
|
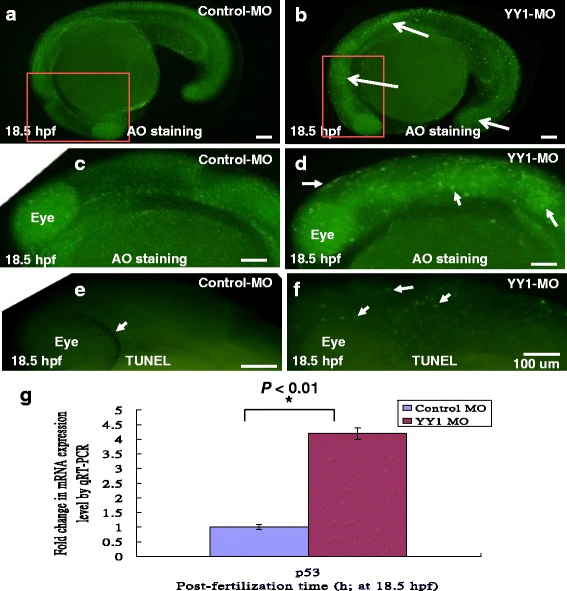
Fig. 2
Apoptotic cell analysis by AO staining and TUNEL assay. Control-MO and YY1-MO (25 ng per embryo) were injected at the one-cell stage to block translation of YY1a mRNA. The embryos were fixed and observed at the different stages postfertilization (pf). The AO-stained embryos are shown in a (Control-MO; 18.5 hpf), b (YY1-MO; 18.5 hpf), c (Control-MO; 18.5 hpf; enlarged from A), and d (YY1-MO; 18.5 hpf; enlarged from B; strongly AO-positive cells indicated by arrows). TUNEL stained embryos (all at 18.5 hpf) are shown in e (Control-MO) and f (YY1-MO group). Identification of apoptotic cell death-related gene P53 at 18.5 hpf by qRT-PCR approach as a control is shown in (g). All data were analyzed using either paired or unpaired Student’s t-tests as appropriate. *P < 0.01. The TUNEL-positive cells under the fluorescence microscope are considered apoptotic. Bars indicate 100 µm