
Image
|
Figure Caption
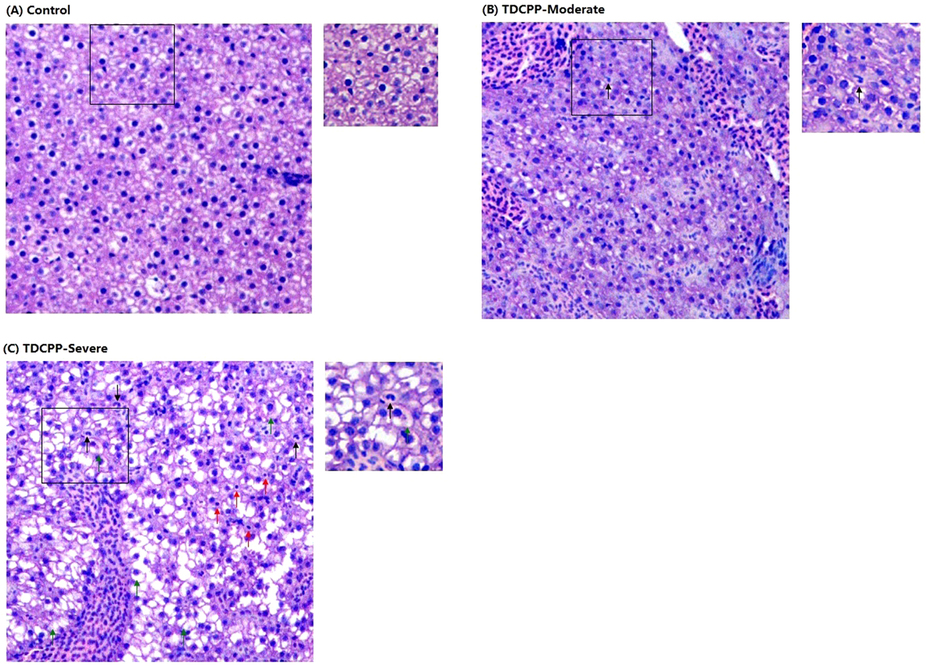
Fig. 3
Changes of liver histology of male zebrafish after exposure to 1 mg/L TDCIPP for 4 days.
Liver sections were stained by hematoxylin and eosin. (A) representative liver section from the DMSO vehicle control group. (B,C) Two representative liver sections from two individual fish of the same TDCIPP group with a moderate effect (B) and a severe effect (C). The left images have a magnification of 200X and the right images have a magnification of 400X. Several features are exampled by arrows of different colors: neutrophils (black); apoptosis (red); hepatic vacuolization (green).
Acknowledgments
This image is the copyrighted work of the attributed author or publisher, and
ZFIN has permission only to display this image to its users.
Additional permissions should be obtained from the applicable author or publisher of the image.
Full text @ Sci. Rep.