
IMAGE
Fig. 5
- ID
- ZDB-IMAGE-160226-11
- Publication
- Liu et al., 2016 - Acute Exposure to Tris(1,3-dichloro-2-propyl) Phosphate (TDCIPP) Causes Hepatic Inflammation and Leads to Hepatotoxicity in Zebrafish
- All Figures
- Figures for Liu et al., 2016
Image
|
Figure Caption
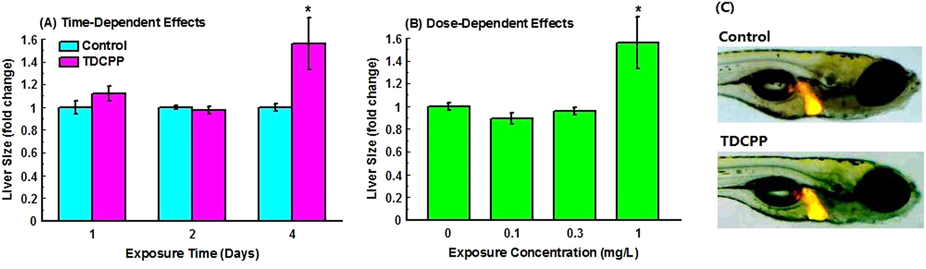
Fig. 5
Dose- (A) and time-dependent (B) increase of liver size in Tg(fabp10a:DsRed) zebrafish larvae after exposure to TDCIPP.Images were captured with a digital camera attached to a Carl Zeiss LSM 510 Meta fluorescent microscope. Liver sizes were measured based on the 2D image using the ImageJ software. (C) Representative images from control group and 4-day TDCIPP (1 mg/L) exposure group Values represent mean ± SEM. Significant difference between the two groups were observed: P < 0.05.
Acknowledgments
This image is the copyrighted work of the attributed author or publisher, and
ZFIN has permission only to display this image to its users.
Additional permissions should be obtained from the applicable author or publisher of the image.
Full text @ Sci. Rep.