
|
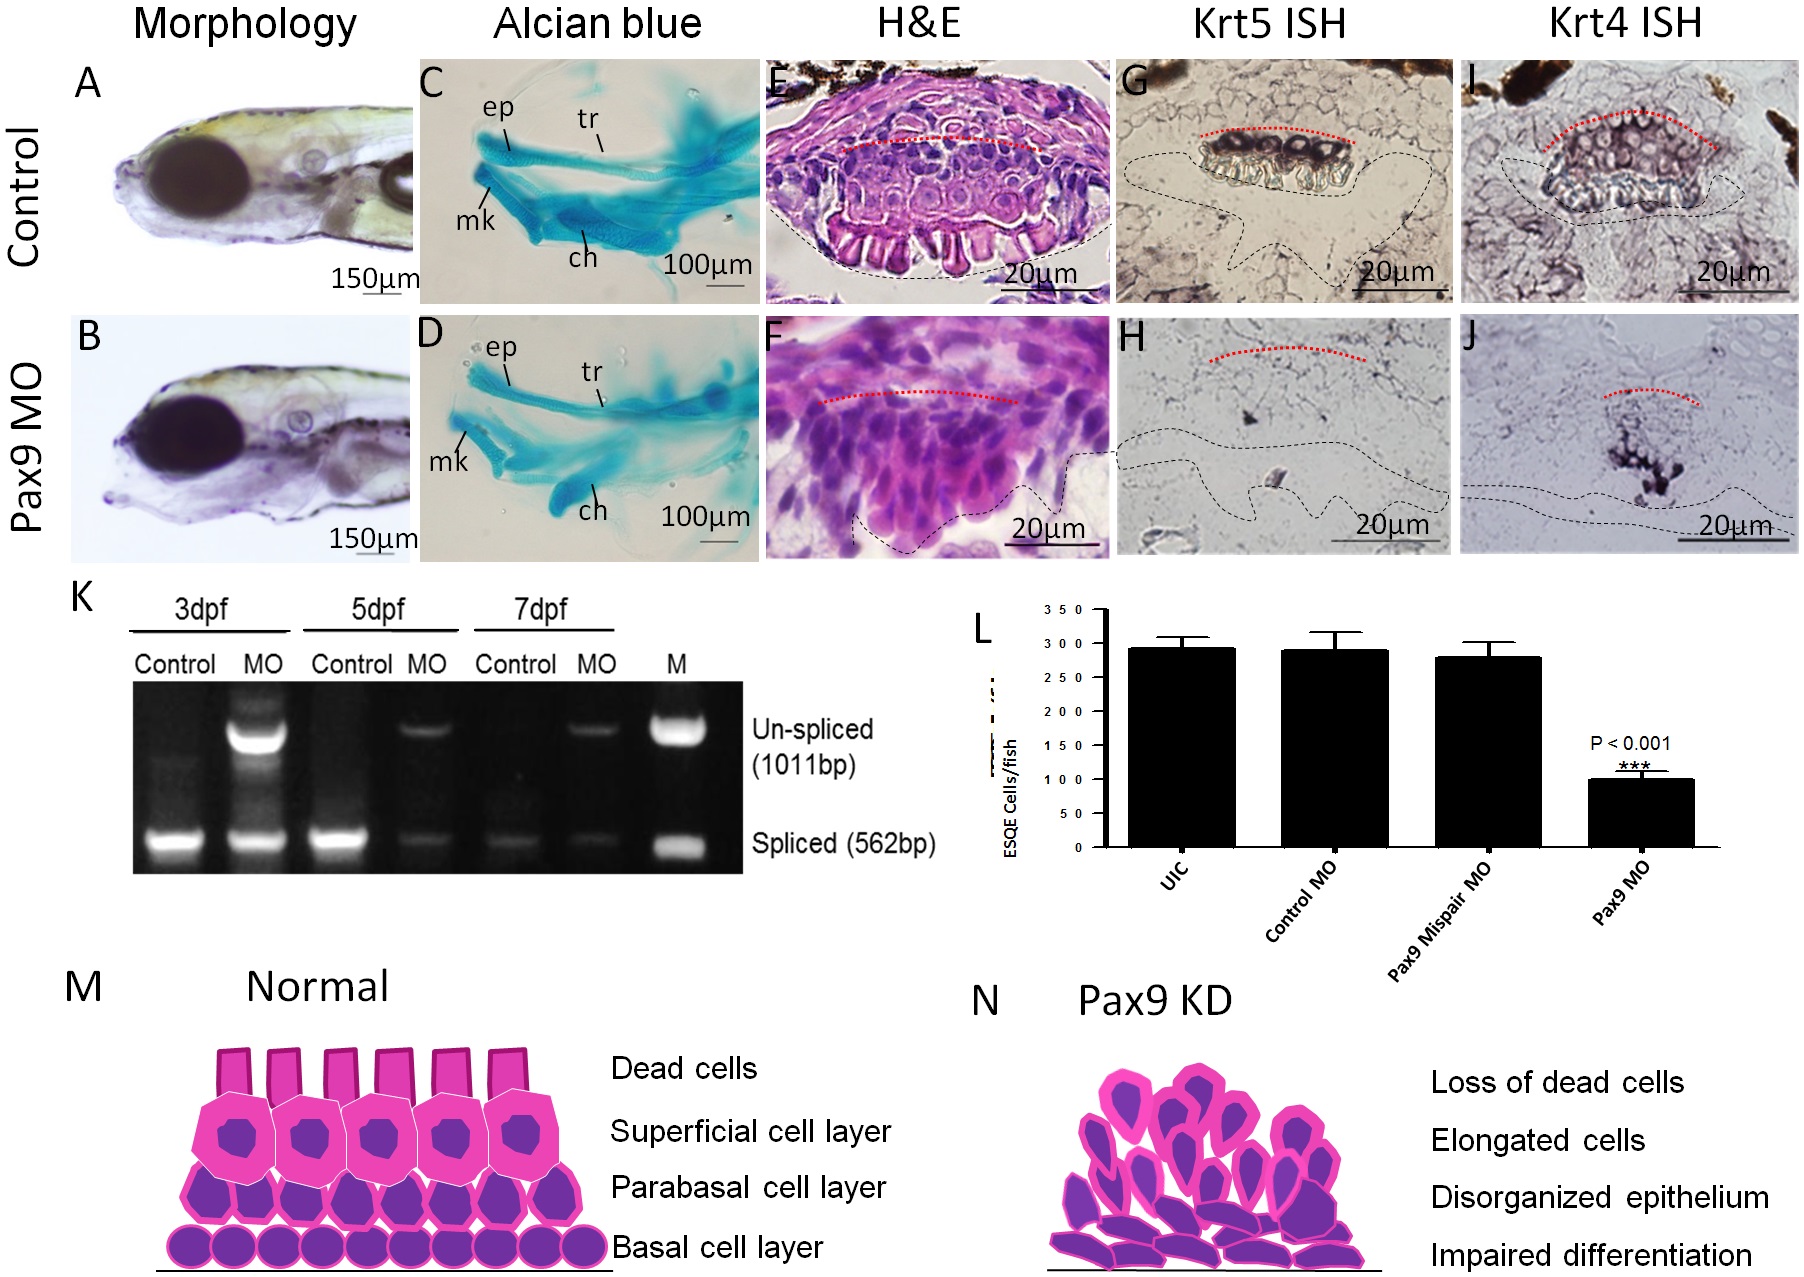
Fig. 3
Expression of Pax9 in zebrafish ESQE and phenotypes of Pax9 knockdown zebrafish at 7dpf.(A) Normal zebrafish (Lateral view). (B) Pax9 knockdown fish with malformation of the lower jaw (Lateral view). (C) Alcian blue staining shows the orofacial cartilage of normal zebrafish (lateral view). (D) Alcian blue staining shows the malformed cartilage of Pax9 knockdown zebrafish (lateral view). (E) Normal ESQE in zebrafish. (F) Disorganized ESQE in a Pax9 knockdown zebrafish. (G) Krt5 ISH on normal zebrafish ESQE. (H) Krt5 ISH on Pax9 knockdown zebrafish ESQE. (I) Krt4 ISH on normal zebrafish ESQE. (J) Krt4 ISH on Pax9 knockdown zebrafish ESQE. (K) RT-PCR for Pax9 shows the un-spliced Pax9 transcript in MO injected zebrafish at 3, 5 and 7dpf. (L) Quantification shows a significant decrease of the number of ESQE cells in Pax9 knockdown zebrafish as compared with controls. (M) A schematic cartoon of normal zebrafish ESQE at 7dpf. (N) A schematic cartoon of Pax9 knockdown zebrafish ESQE at 7dpf. ep, ethmoid plate; ch, ceratohyal; mk, Meckel’s cartilage; tr, trabeculae. All the pictures are dorsal side up. Base membrane of the squamous epithelium is marked with red dotted line and esophageal lumen is lined with black dotted line.