
|
Fig. S2
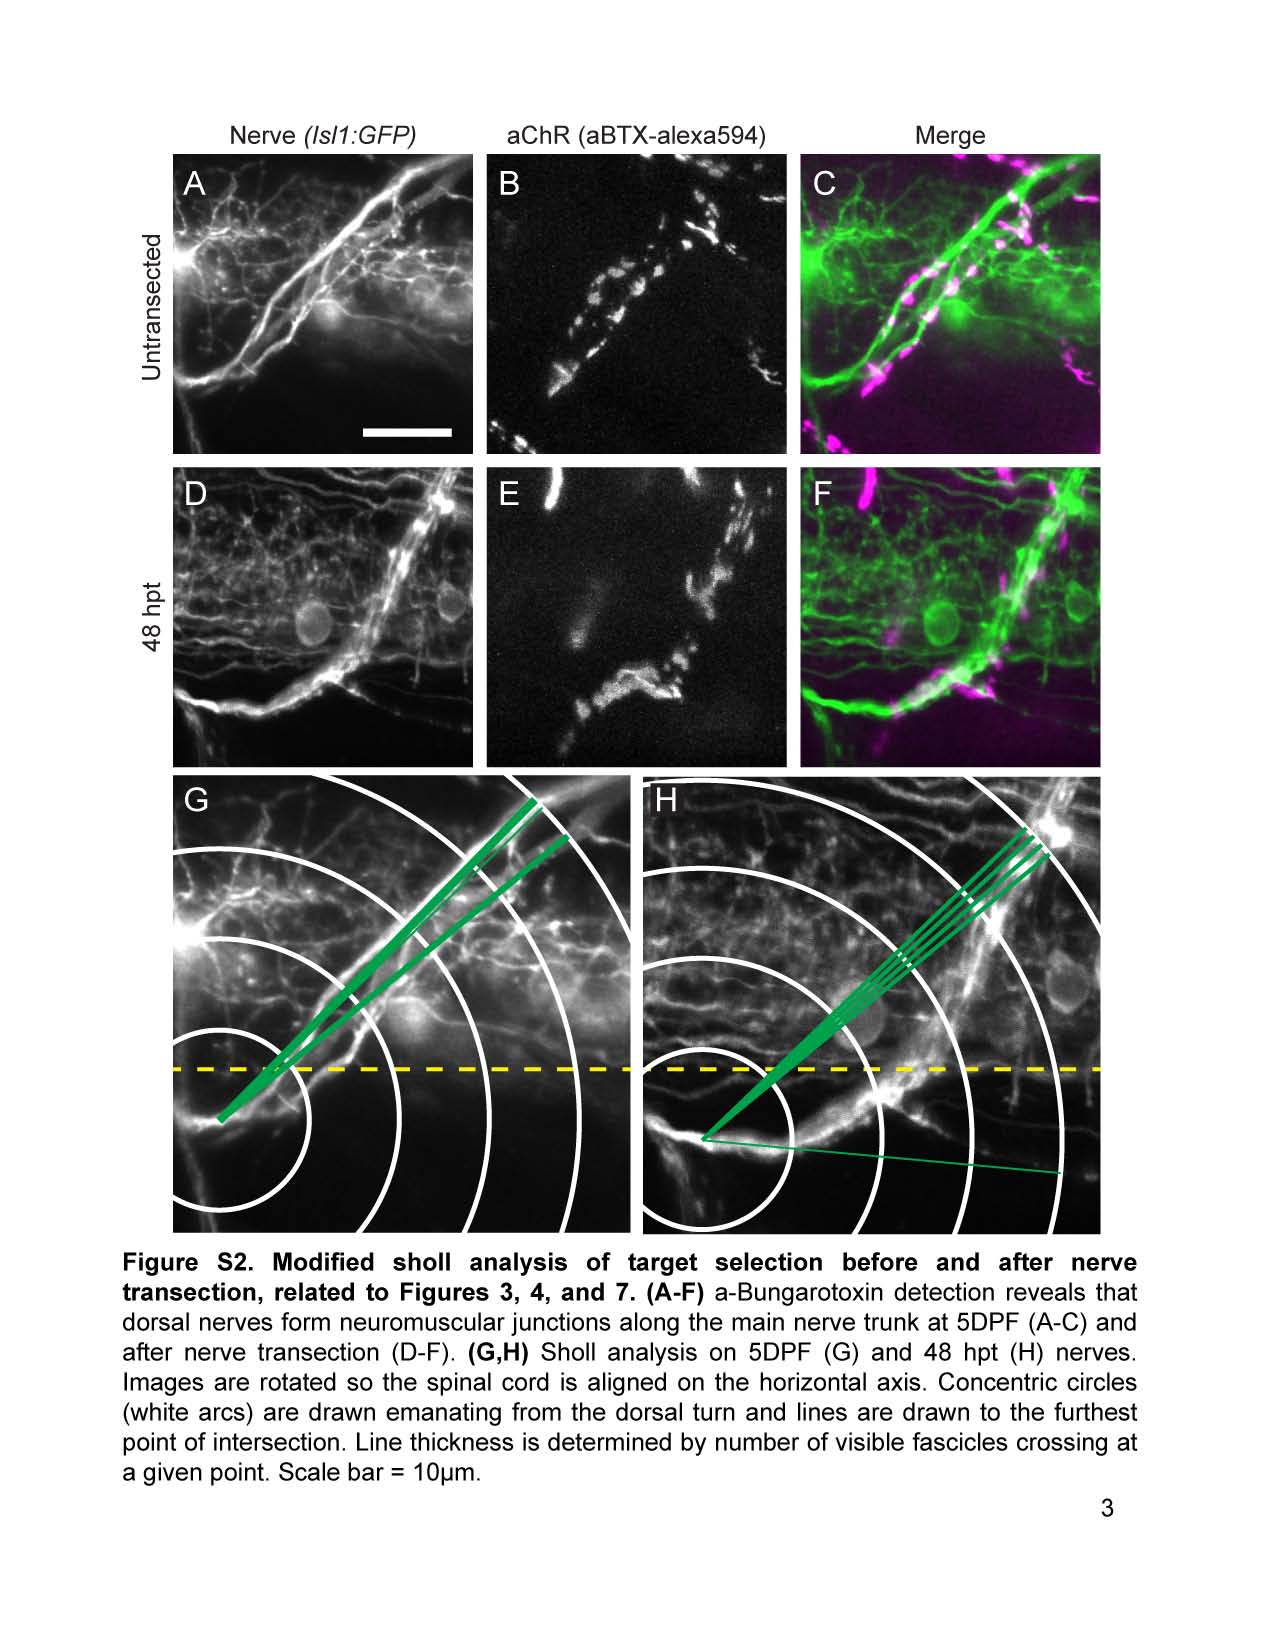
Modified sholl analysis of target selection before and after nerve transection, related to Figures 3, 4, and 7.
(A-F) a-Bungarotoxin detection reveals that dorsal nerves form neuromuscular junctions along the main nerve trunk at 5DPF (A-C) and after nerve transection (O-F).
(G,H) Sholl analysis on 5DPF (G) and 48 hpt (H) nerves. Images are rotated so the spinal cord is aligned on the horizontal axis. Concentric circles (white arcs) are drawn emanating from the dorsal turn and lines are drawn to the furthest point of intersection. Line thickness is determined by number of visible fascicles crossing at a given point. Scale bar = 10µm.