
|
Fig. 3
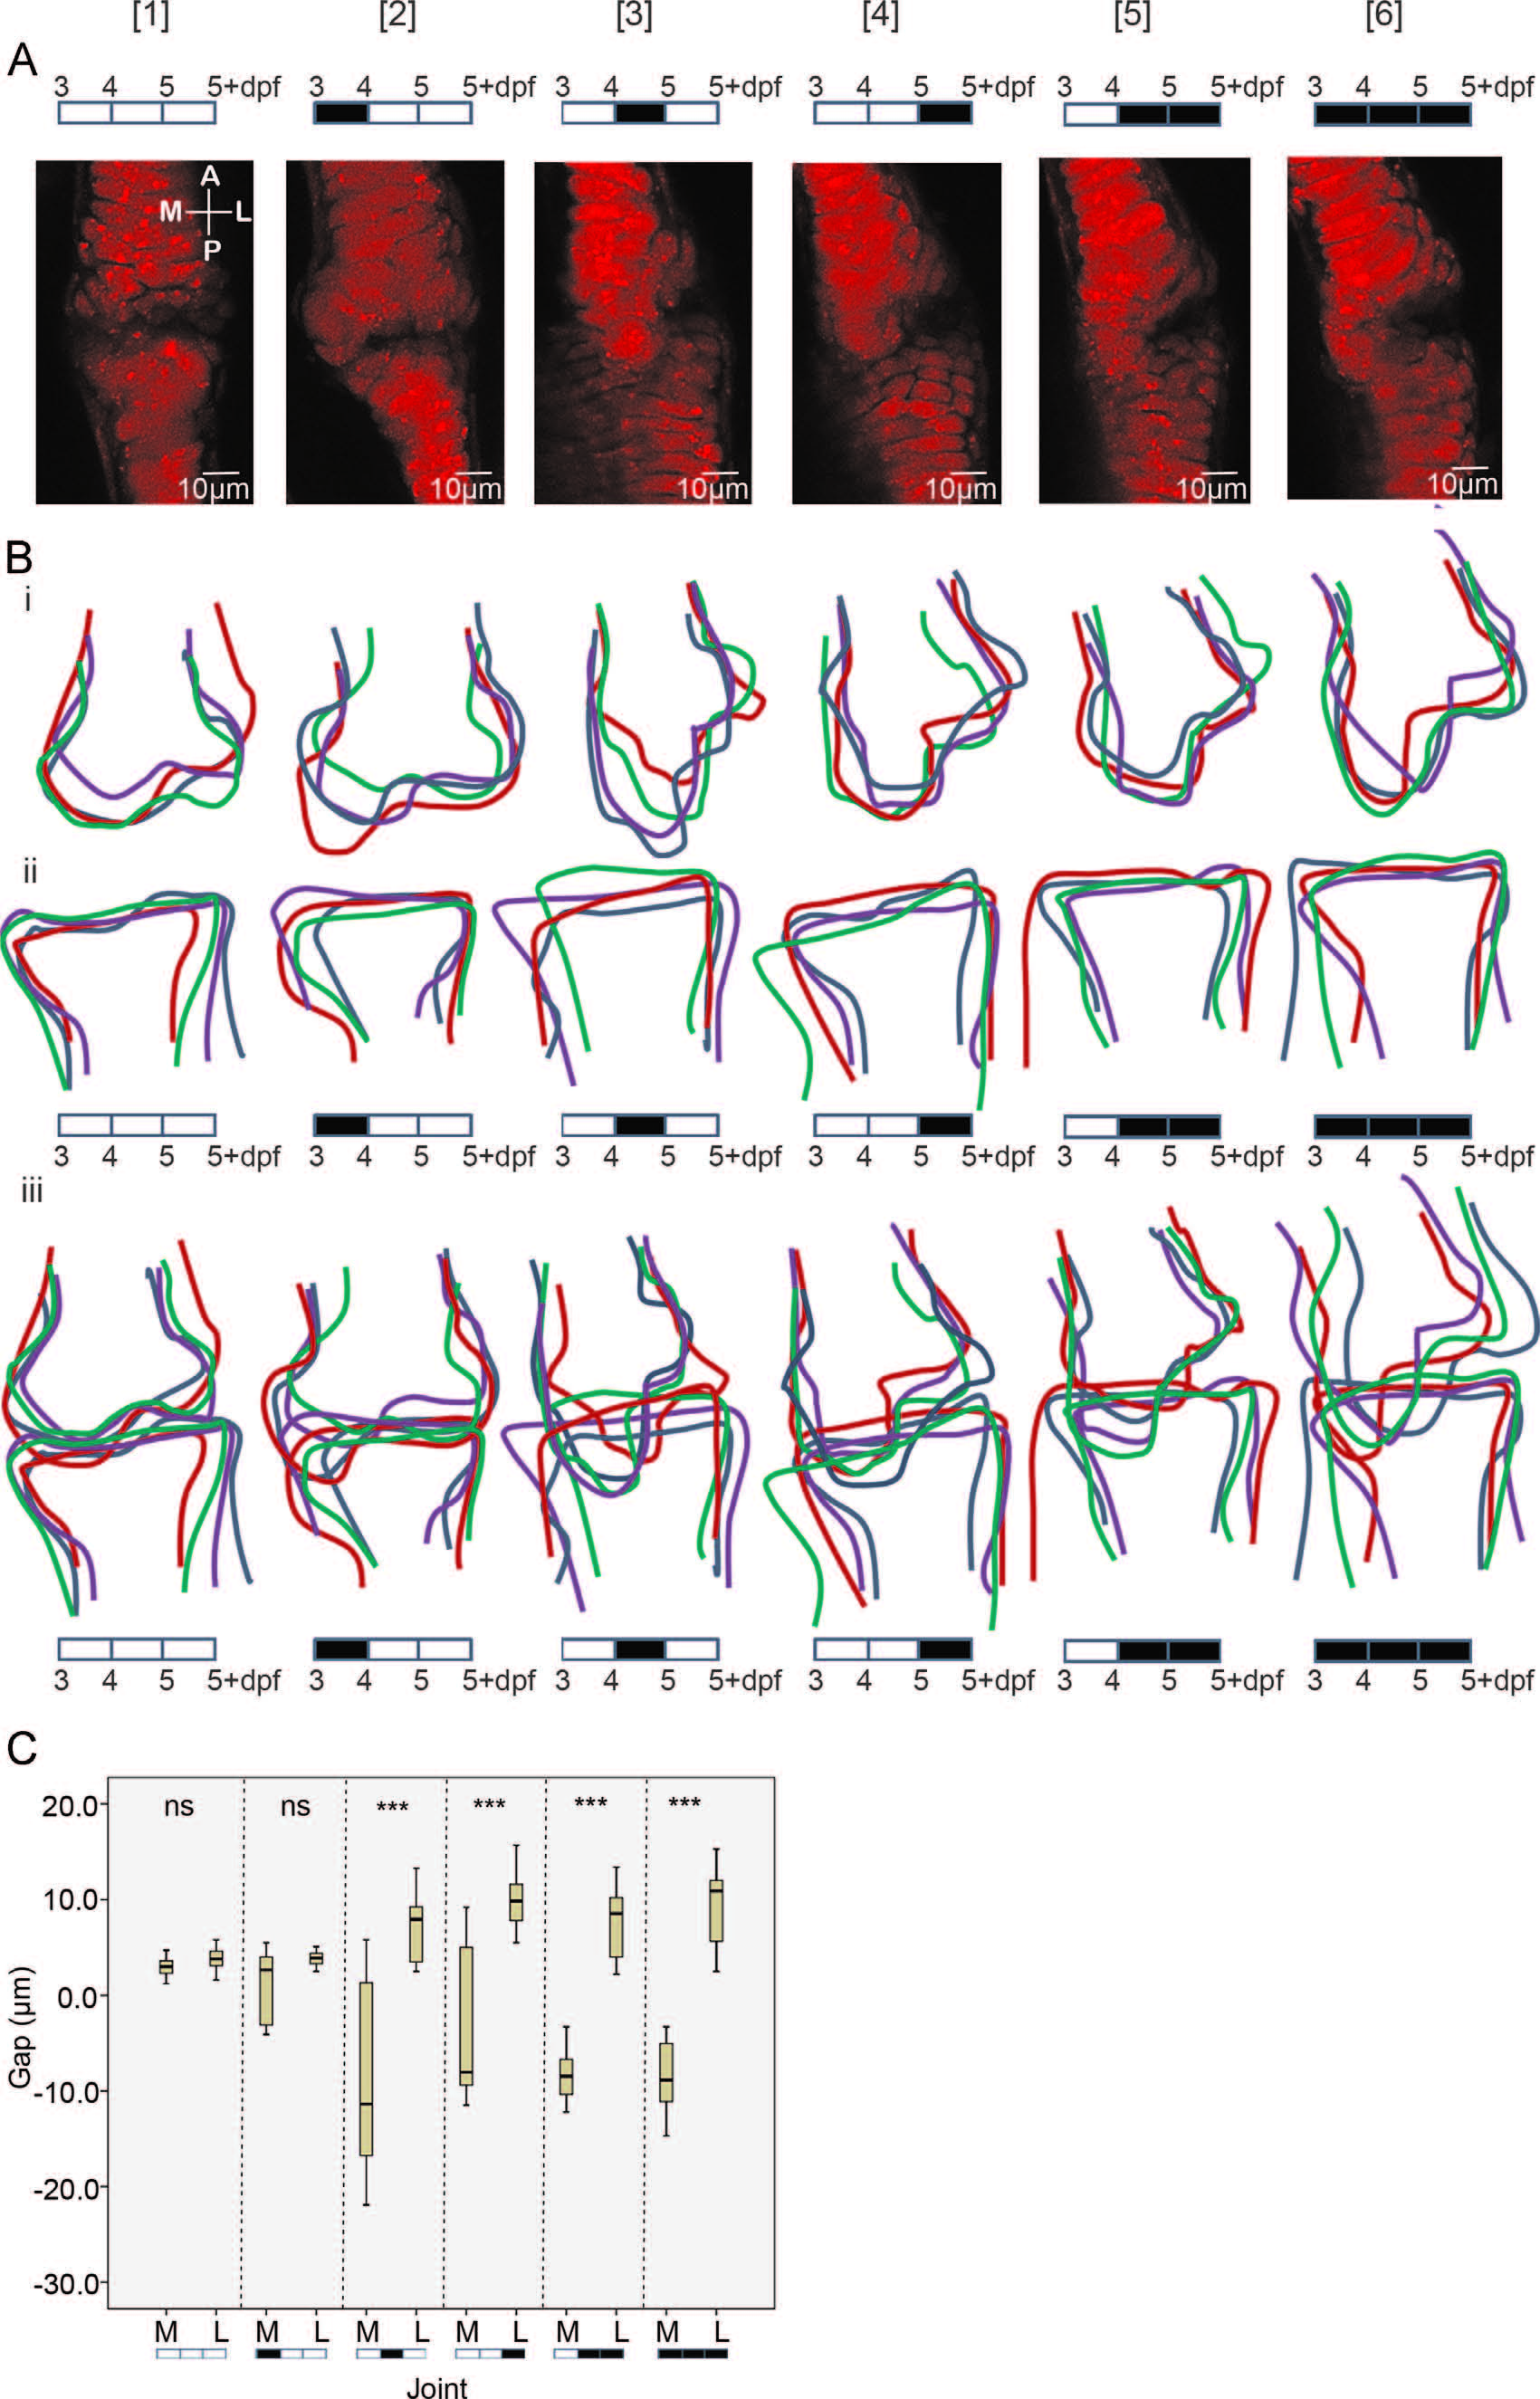
Imaging and quantification of joint shape. (A); zebrafish 5+ dpf jaw joints labelled with the Tg(Col2a1aBAC:mcherry) cartilage marker, anaesthetised with MS222 for varying time periods between 3 and 4 [2], 4 and 5 [3], 5 and 5+ [4], 4–5+ [5] and 3–5+dpf [6]. (5+dpf=128 hpf). A black box on the 3–5+dpf timeline indicates anaesthetisation by MS222 and an empty box indicates no MS222 treatment. The medial and lateral side of the elements are labelled M and L and the anterior and posterior surfaces of the elements are labelled A and P. (B): Outline of the 5+ dpf jaw joint shape after each anaesthetic treatment, anterior Meckel′s cartilage joint element (Bi), posterior Palatoquadrate joint element (Bii), and the extent of the joint element overlap (Biii) (n=4, each colour representing an individual fish). All outlines are to the same scale. (C): Box and whisker plot of the interval between the anterior MC and posterior PQ elements on the medial and lateral side of the joints at 5+dpf (n=13, 13, 10, 10, 16, 16, 18, 16, 8, 8, 12, 14, 8, 8), ns=not significant, ***=Pd0.001. Negative measurements indicate an overlap of the anterior MC and posterior PQ elements.