
Fig. 3
- ID
- ZDB-IMAGE-151113-2
- Publication
- Xu et al., 2015 - Temporal-Spatial Resolution Fate Mapping Reveals Distinct Origins for Embryonic and Adult Microglia in Zebrafish
- All Figures
- Figures for Xu et al., 2015
|
Fig. 3
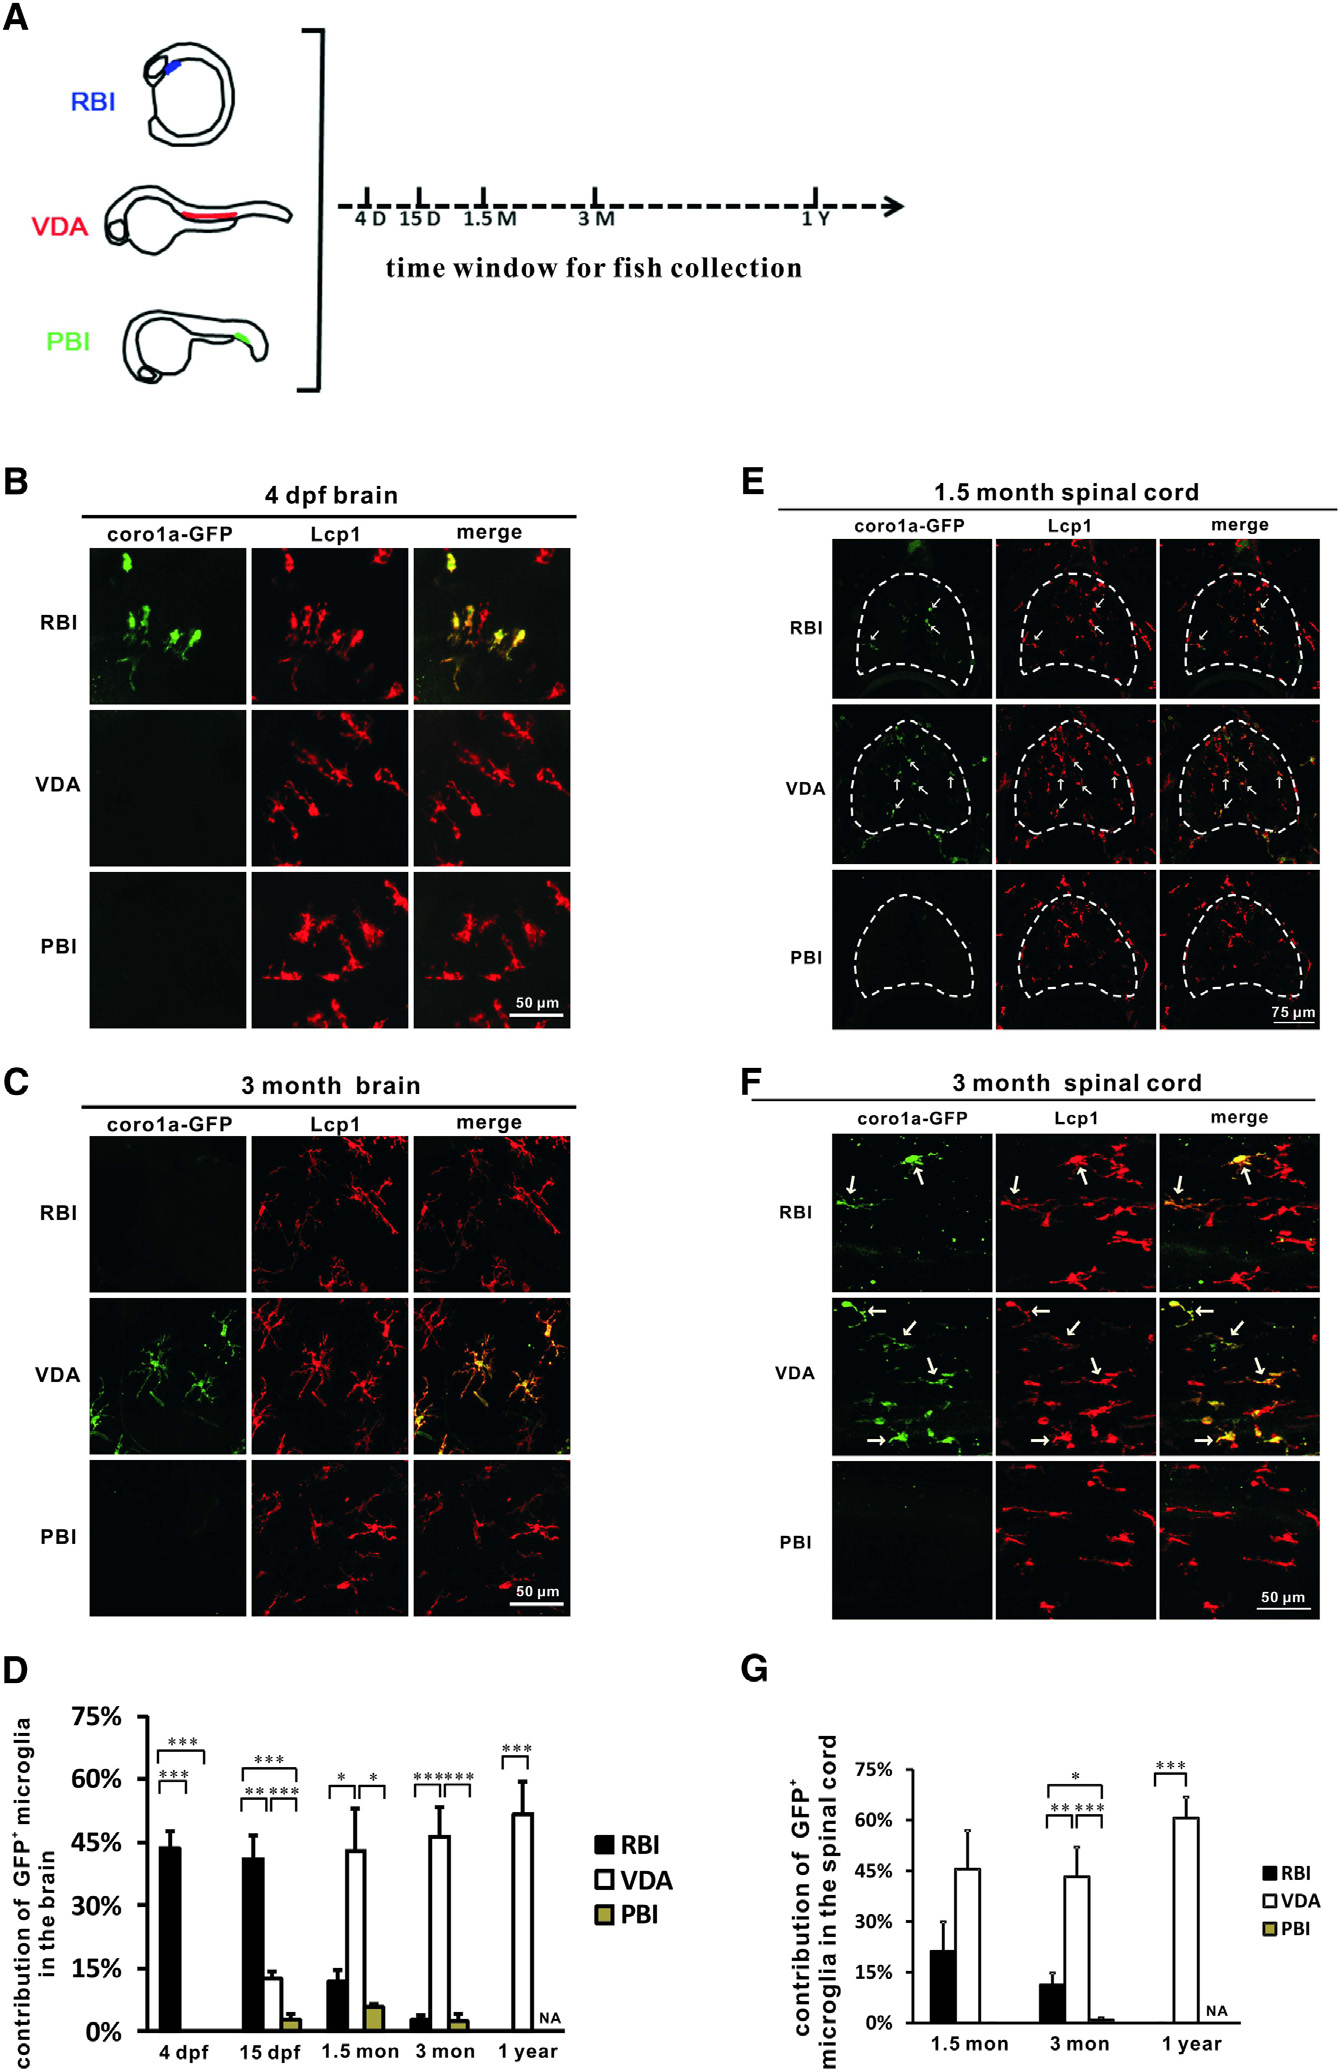
Embryonic/Larval and Adult Microglia in Zebrafish CNS Arise from Distinct Origins
(A) A timeline shows the experimental setup. The RBI-, VDA-, and PBI-region-labeled fish were raised and collected at 4 dpf, 15 dpf, 1.5 months, 3 months, and 1 year for analysis.
(B) Immunohistochemistry showed that the RBI- but not VDA- and PBI-region-derived cells (coro1a-GFP+ cells) constitute the major population of microglia (Lcp1+ cells) in the brains of 4-dpf zebrafish (dorsal view, rostral to the left, a part of the optic tectum).
(C) Immunohistochemistry showed that the VDA- but not RBI- and PBI-derived cells (coro1a-GFP+ cells) constitute the major population of microglia (Lcp1+ cells) in the brains of 3-month-old adult zebrafish (sectioned brain).
(D) Quantification of the contribution of the RBI-, VDA-, and PBI-region -derived microglia in the developing and adult zebrafish brain. For the RBI-labeled 4-dpf, 15-dpf, 1.5-month, 3-month, and 1-year adult fish, n = 8, 8, 5, 8, and 10, respectively; for the VDA-region-labeled 4-dpf, 15-dpf, 1.5-month, 3-month, and 1-year adult fish, n = 5, 6, 5, 8, and 9, respectively; for the PBI-labeled 4-dpf, 15-dpf, 1.5-month, and 3-month adult fish, n = 7, 6, 7, and 8 respectively. Error bars represent mean ± SEM. p < 0.05; p < 0.01; p < 0.001.
(E) Immunohistochemistry showed the contribution of the RBI-, VDA-, and PBI-region-derived cells (coro1a-GFP+ cells) to microglia (Lcp1+ cells) in the sectioned 1.5-month zebrafish spinal cord (indicated by the dashed lines). White arrows indicate the coro1a-GFP+ microglia in the spinal cord.
(F) Immunohistochemistry showed the contribution of the RBI-, VDA-, and PBI-region-derived cells (coro1a-GFP+ cells) to microglia (Lcp1+ cells) in the whole-mount 3-month adult zebrafish spinal cord. White arrows indicate the coro1a-GFP+ microglia in the spinal cord.
(G) Quantification of the contribution of RBI-, VDA-, and PBI-region-derived microglia in 1.5-month, 3-month, and 1-year adult zebrafish spinal cord. For the RBI-labeled 1.5-month, 3-month, and 1-year adult fish, n = 6, 12, and 8, respectively; for the VDA-region-labeled 1.5-month, 3-month, and 1-year adult fish, n = 4, 5, and 9, respectively; for the PBI-labeled 1.5-month and 3-month adult fish, n = 5 and 6, respectively. Error bars represent mean ± SEM. p < 0.05; p < 0.01; p < 0.001.
See also Figure S2.
Reprinted from Developmental Cell, 34, Xu, J., Zhu, L., He, S., Wu, Y., Jin, W., Yu, T., Qu, J.Y., Wen, Z., Temporal-Spatial Resolution Fate Mapping Reveals Distinct Origins for Embryonic and Adult Microglia in Zebrafish, 632-641, Copyright (2015) with permission from Elsevier. Full text @ Dev. Cell