
Fig. 2
- ID
- ZDB-IMAGE-151113-1
- Publication
- Xu et al., 2015 - Temporal-Spatial Resolution Fate Mapping Reveals Distinct Origins for Embryonic and Adult Microglia in Zebrafish
- All Figures
- Figures for Xu et al., 2015
|
Fig. 2
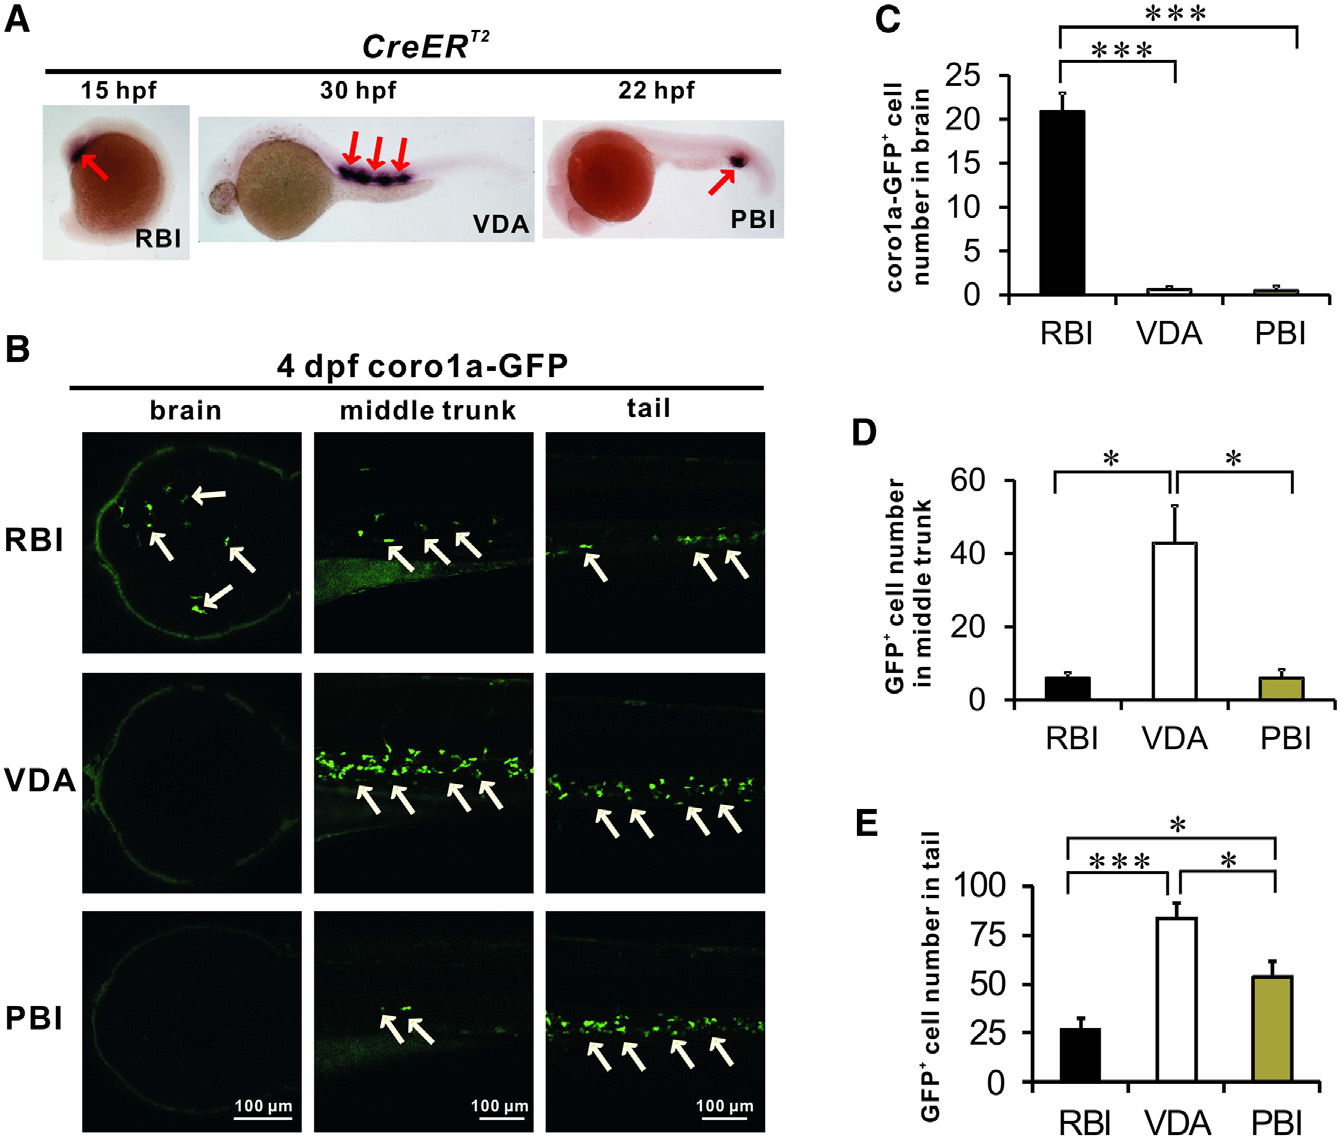
The IR-LEGO-CreER-loxP System Provides a High Temporal-Spatial Resolution Labeling in Zebrafish RBI, VDA, and PBI Regions
(A) Overexposed WISH staining shows that local 1,345 nm laser irradiation induces CreERT2 expression in the RBI, VDA, and PBI regions. Red arrows indicate the overexposed CreERT2 staining.
(B) The distribution of the RBI-, VDA-region-, or PBI-derived cells (coro1a-GFP+ cells) in the brain, middle trunk, and tail at 4 dpf. The RBI-derived cells (top) were found in brain (dorsal view, rostral to the left, midbrain region), middle trunk, and tail (blue and orange boxed regions shown in Figure 1B), whereas the VDA-region-derived (middle) and PBI-derived (bottom) cells were detected in the trunk and tail but rarely in the brain. White arrows indicate GFP+ cells.
(C) Quantification of GFP+ cells derived from the RBI (n = 9), VDA region (n = 10), or PBI (n = 6) in the brain. Error bars represent mean ± SEM. p < 0.001.
(D) Quantification of GFP+ cells derived from the RBI (n = 6), VDA region (n = 6), or PBI (n = 6) in the middle trunk. Error bars represent mean ± SEM. p < 0.05.
(E) Quantification of GFP+ cells derived from the RBI (n = 6), VDA region (n = 6), or PBI (n = 6) in the tail. Error bars represent mean ± SEM. p < 0.05; p < 0.001.
See also Figure S1.
Reprinted from Developmental Cell, 34, Xu, J., Zhu, L., He, S., Wu, Y., Jin, W., Yu, T., Qu, J.Y., Wen, Z., Temporal-Spatial Resolution Fate Mapping Reveals Distinct Origins for Embryonic and Adult Microglia in Zebrafish, 632-641, Copyright (2015) with permission from Elsevier. Full text @ Dev. Cell