
|
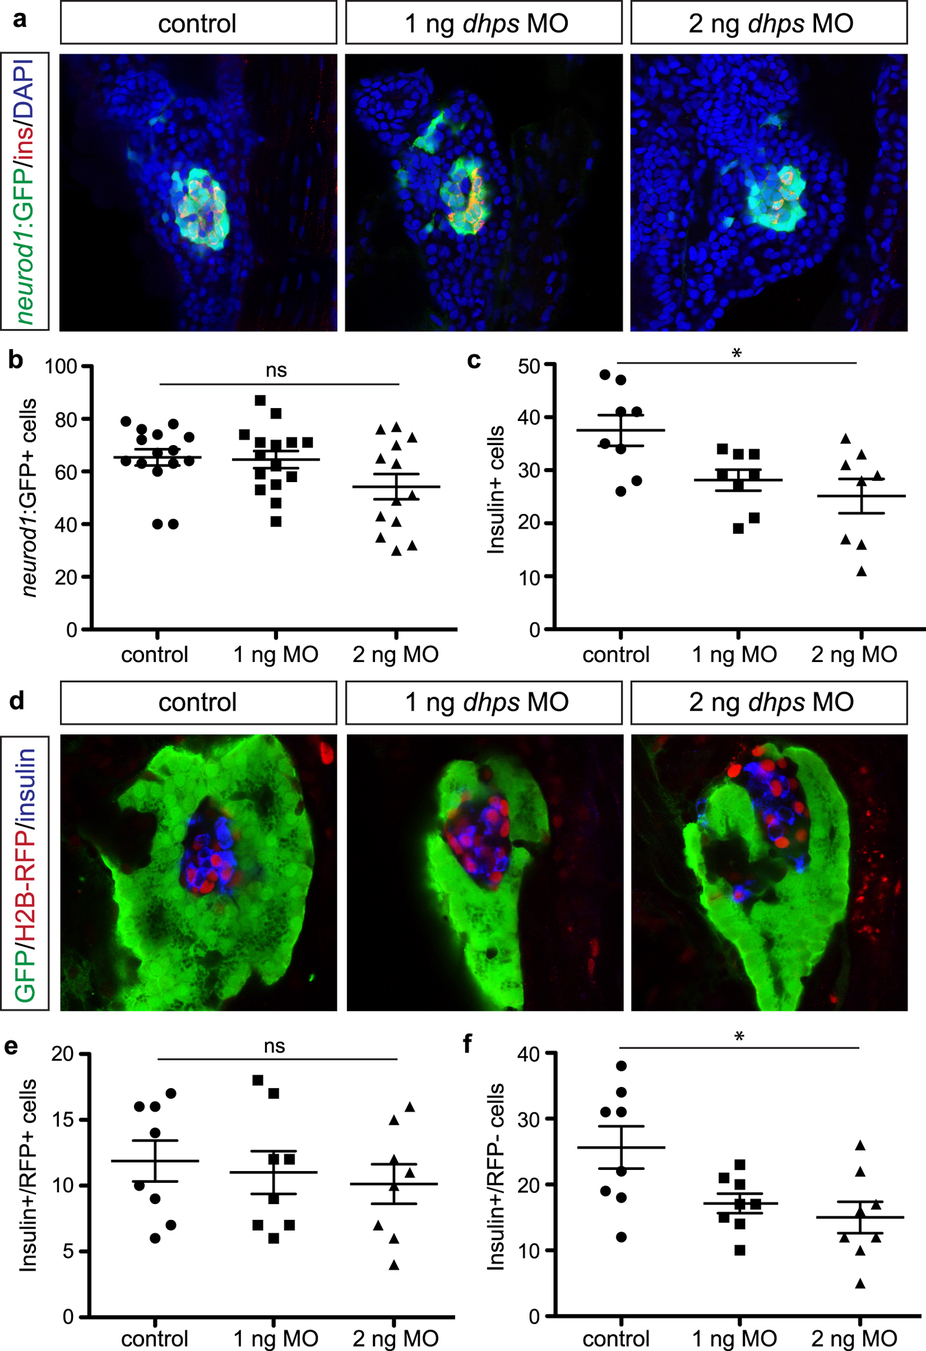
Fig. 7
Knockdown of dhps inhibits β cell differentiation.
(a) Representative images of neurod1:GFP + endocrine cells in the pancreas of control, 1 ng MO-injected, and 2 ng MO-injected Tg(neurod1:gfp) embryos at 72 hpf. Quantification of the number of (b) neurod1:GFP + cells in control (n = 15), 1 ng MO-injected (n = 15), and 2 ng MO-injected (n = 13) embryos (p = 0.0783), and (c) insulin + β cells in control (n = 8), 1 ng MO-injected (n = 8), and 2 ng MO-injected (n = 8) embryos (p = 0.012), at 72 hpf. (d) Representative images of the insulin + β cells from control, 1 ng MO-injected, and 2 ng MO-injected Tg(ptf1a:gfp) embryos at 72 hpf after label-retaining cell (LRC) assay was performed. LRC + cells express H2B-RFP. Quantification of the number of (e) insulin+/RFP + cells (LRC + or dorsal pancreas-derived cells) in control (n = 8), 1 ng MO-injected (n = 8), and 2 ng MO-injected (n = 8) embryos (p = 0.734), and (f) insulin+/RFP- cells (LRC- or ventral pancreas-derived cells) in control (n = 8), 1 ng MO-injected (n = 8), and 2 ng MO-injected (n = 8) embryos (p = 0.0147), at 72 hpf. *p < 0.05, **p < 0.01, ***p < 0.001; ns, not significant.