
|
Fig. 1
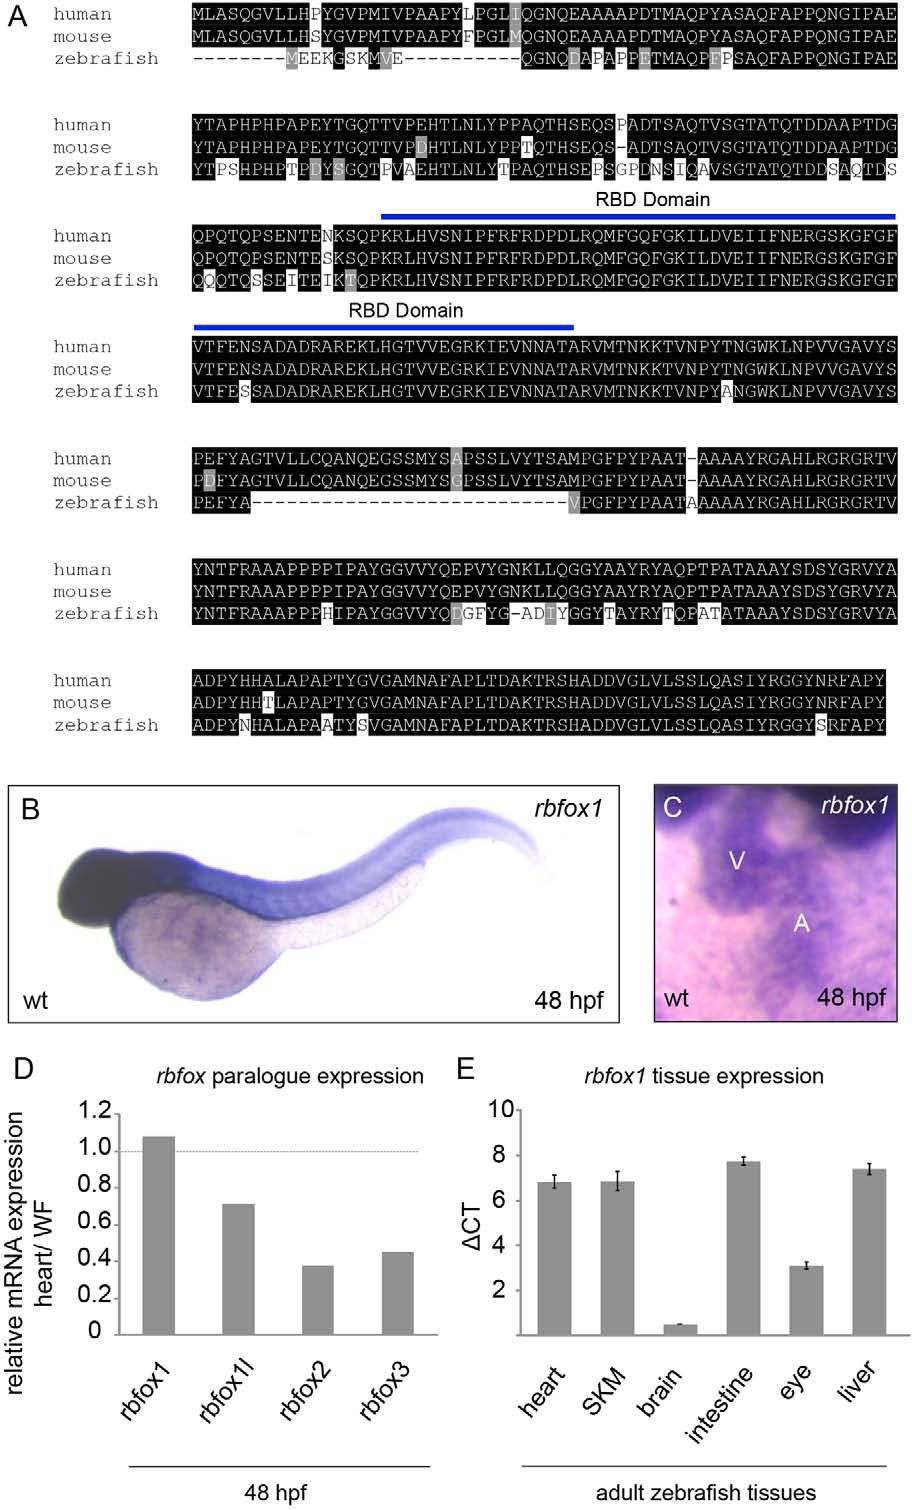
Expression analysis of rbfox1 in zebrafish. (A) Amino acid sequence alignments of human, mouse and zebrafish rbfox1 demonstrating the high cross-species homology. Black background, amino acid identity; gray background, amino acids with similar chemical properties. (B,C) RNA antisense in situ hybridization against rbfox1 demonstrates a specific mRNA expression in neuronal, heart cells and skeletal muscle at 48hpf (V, ventricle; A, atrium). wt, wild-type. (D) Relative expression analysis of rbfox mRNAs shows that rbfox1 is highly expressed in the heart in comparison to the other rbfox family members. WF, whole fish. (E) qRT-PCR analysis of rbfox1 in different tissues of adult zebrafish reveals the highest expression in brain and eye tissue, and an equal expression in heart, skeletal muscle (SKM), intestine and liver tissue. Data are shown as mean±s.d. (pooled tissue of adult zebrafish n=8, two replicates each). ΔCt values compared to elfa1 as a reference gene.